
Fig. 5
- ID
- ZDB-FIG-260529-18
- Publication
- Tan et al., 2026 - Bi-allelic variants in NDUFA5 cause a mitochondriopathy with complex I deficiency
- Other Figures
- All Figure Page
- Back to All Figure Page
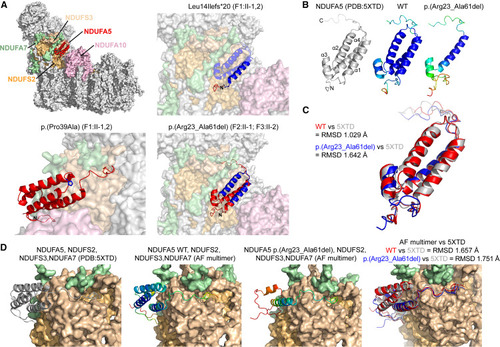
Molecular modeling (A) Cryo-EM structure of the human complex I7 (PDB: 5XTD) with NDUFA5 rendered in cartoon format. The blue regions of NDUFA5 in the subpanels indicate the deleted or substituted residues. (B) Left: cartoon representation of human NDUFA57 with the alpha helices (α) numbered as indicated. Middle and right: AlphaFold220 models of WT and Arg23_Ala61del NDUFA5 colored according to pLDDT (red, low confidence; blue, high confidence). (C) Alignment of structures in (B) using the super algorithm with the RMSD of WT (red) and Arg23_Ala61del (blue) NDUFA5 aligned to the experimentally observed protein (gray) as indicated. (D) Left: experimentally determined7 structure (extracted from PDB: 5XTD) for the subcomplex of NDUFA5 (gray), NDUFS2, NDUFS3, and NDUFA7 (subunits are colored as in A). Middle: AlphaFold-multimer21 models of subcomplex containing WT or Arg23_Ala61del NDUFA5 colored according to pLDDT. Right: RMSD of the WT (red) or Arg23_Ala61del (blue) containing subcomplexes aligned to the experimentally determined structure. |