
Fig. 3
- ID
- ZDB-FIG-260529-16
- Publication
- Tan et al., 2026 - Bi-allelic variants in NDUFA5 cause a mitochondriopathy with complex I deficiency
- Other Figures
- All Figure Page
- Back to All Figure Page
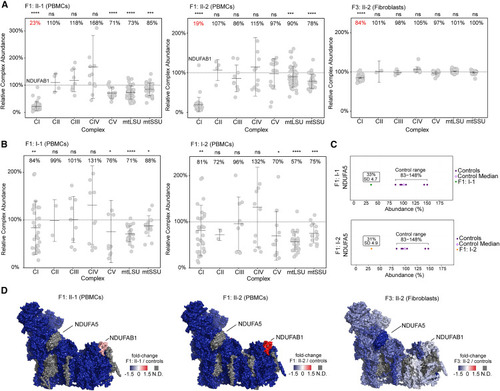
Proteomic studies (A) Relative complex abundance (RCA) of oxidative phosphorylation (OXPHOS) complexes and mitoribosome subunits of peripheral blood mononuclear cells (PBMCs) from family 1 proband (F1:II-1) and affected sibling (F1:II-2) and fibroblasts from family 3 proband (F3:II-2). Middle bar represents mean complex abundance. Upper and lower bars represent 95% confidence interval. Significance was calculated from a two-sided t test between the individual protein means. ∗∗∗∗p < 0.0001, ∗∗∗p < 0.001, ∗∗p < 0.01, ∗p < 0.05; ns, not significant (p > 0.05). CI–CV, OXPHOS complexes I–V; mtLSU, mitoribosome large subunit; mtSSU, mitoribosome small subunit. (B) RCA of PBMCs from family 1 carrier parents (F1:I-1 and F1:I-2). Middle bar represents mean complex abundance. Upper and lower bars represent 95% confidence interval. Significance was calculated from a two-sided t test between the individual protein means. ∗∗∗∗p < 0.0001, ∗∗∗p < 0.001, ∗∗p < 0.01, ∗p < 0.05; ns, not significant (p > 0.05). CI–CV, OXPHOS complexes I–V; mtLSU, mitoribosome large subunit; mtSSU, mitoribosome small subunit. (C) Abundance range of NDUFA5 protein in PBMCs from F1:I-1 and F1:I-2 (carriers) relative to the median (purple diamond) of six individual adult controls (n = 6, purple dots). SD, standard deviation. (D) Topographical heatmap of the fold-change values of complex I subunits in probands F1:II-1, F1:II-2, and F3:II-2 relative to controls. PDB: 5LDW. N.D., not detected (shown as gray in images). |