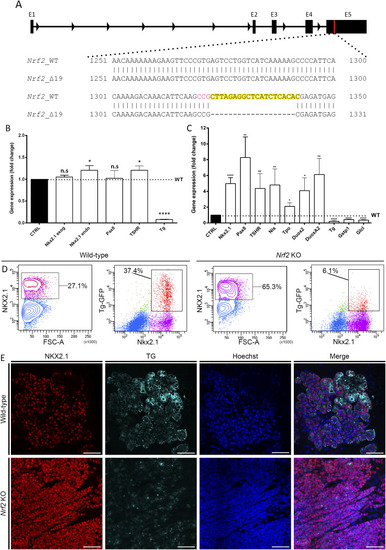
Studies of Nrf2 KO mESC-derived thyroid organoids highlight the importance of Nrf2 during mammalian thyroid development.
(A) 19-nt deletion was generated in the exon 5 (E5) of the Nrf2 gene resulting in a frameshift-inducing premature stop codon disturbing the DNA binding domain of the gene. The guide sequence is highlighted in yellow with the PAM sequence highlighted in magenta. (B) qRT-PCR analysis performed on day 7 of the differentiation protocol demonstrates significant down-regulation in Tg gene expression and slight up-regulation in Nkx2.1 and Tshr gene expression. (C) qRT-PCR analysis performed at the end of the differentiation protocol (at day 22) demonstrates significant up-regulation in Nkx2.1, Pax8, Tshr, Nis, Tpo, Duox2, and Duoxa2 gene expression and significant down-regulation in Tg, Gstp1, and Gclc gene expression. All qRT-PCR data show relative gene expression compared with their respective control (NT, nontreated; or –WT, wild type) represented by the black column. The dashed black line shows the control expression level across the panel to allowing visual comparison of the gene expression with their control. All statistical analyses were performed using the Mann–Whitney test. The asterisks denote a significant difference compared with the WT control: *P < 0.05, **P < 0.01, and ****P < 0.001. (D) Flow cytometry analysis of WT (first and second panels from the left) and Nrf2 KO (third and fourth panels from the left) thyroid organoids after 22 d of differentiation. First and third panels show the proportion of NKX2.1+ cells in the whole sample, and the percentages (%) of NKX2.1+ cells are displayed. Second and fourth panels show the proportion of bTg+ cells within the Nkx2.1+ cell population, and the percentages (%) are displayed. (E) Confocal images obtained after immunofluorescence experiments on fixed samples after 22 d of differentiation. Samples were marked for Nkx2.1 (red) and Tg (cyan). Nuclei were labeled using Hoechst (Blue). Scale bars: 100 μm.
|
