
Fig. 5
- ID
- ZDB-FIG-260423-5
- Publication
- Grassi et al., 2026 - Patient-Derived in Vitro Models Reveal Insights into Medullary Thyroid Cancer Microenvironment and Resistance to Tyrosine Kinase Inhibitors
- Other Figures
- All Figure Page
- Back to All Figure Page
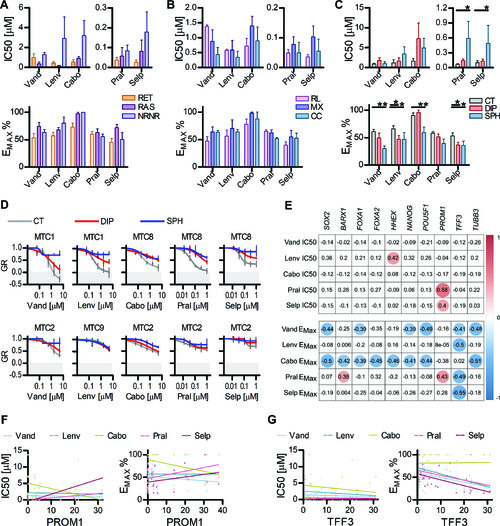
MTC lines unveil patterns of tyrosine-kinase inhibitors resistance. (A) differences in drug sensitivity for different KI (Vandetanib, Lenvatinib, Cabozantinib, Pralsetinib, and Selpercatinib), represented as IC50 and EMAX, among cell lines grouped by genetic background, indicative of higher resistance for non-RAS non-RET (NRNR) lines and sensitivity to RET-selective KI for the RET-mutated lines. n = 9. (B) Differences in drug sensitivity for different KI (Vandetanib, Lenvatinib, Cabozantinib, Pralsetinib, and Selpercatinib), represented as IC50 and EMAX, among cell lines grouped by similarity analysis, indicative of relative sensitivity to multi-KI of the Cell Cycle (CC) group compared with the mixed (MX) and RET-like (RL) ones. n = 9. (C) Differences in drug sensitivity for different KI (Vandetanib, Lenvatinib, Cabozantinib, Pralsetinib and Selpercatinib), represented as IC50 and EMAX, among cell lines cultivated in standard control conditions (CT) and in two stem-promoting conditions, DIP induced pseudohypoxia (DIP) and clonal sphere selection (SPH), showing a significant role of stem-like phenotype in induction of drug resistance. n = 27. (D) Representative dose-response Growth Rate (GR) curves showing the most sensible (upper row) and resistant (lower row) cell line for each drug. GR values below zero (gray area) indicate cytotoxic effects and induction of cell death, while values above zero (white area) indicate cytostatic effects and reduction in cell proliferation. Values equal to zero indicate complete arrest of cell growth without cell death. The graphs highlight the significant changes in the response to KI between control adherent cells (CH) and the two stem-promoting conditions, DIP induced pseudohypoxia (DIP) and clonal sphere selection (SPH), a trend also visible in the less sensible cells. n = 4, except MTC4 where b = 3. (E) Correlogram showing significant Pearson’s correlations between the gene expression panel and the IC50 and EMAX values from dose-response curves for Vandetanib, Lenvatinib, Cabozantinib, Pralsetinib, and Selpercatinib. The correlogram demonstrates a significant positive correlation between the RET-selective KI Pralsetinib and Selpercatinib IC50 and PROM1 levels, the significant negative correlation between Vandetanib and Cabozantinib maximal effects and classical stem and C-cells progenitor markers, the significant negative correlation between TFF3 levels and the maximal effect of Vandetanib, Lenvatinib, Pralsetinib, and Selpercatinib, indicating a possible involvement of different stem-like phenotypes in MTC drug resistance. For each dose-response curves n = 4, except MTC6 where n = 3. (F) Linear regression of PROM1 expression values plotted against the IC50 and EMAX values obtained in different growth conditions for Vandetanib, Lenvatinib, Cabozantinib, Pralsetinib, and Selpercatinib, showing positive correlations for Pralsetinib and Selpercatinib and a negative correlation for Cabozantinib. n = 27 for each drug. (G) linear regression of TFF3 expression values plotted against the IC50 and EMAX values obtained in different growth conditions for Vandetanib, Lenvatinib, Cabozantinib, Pralsetinib, and Selpercatinib, showing a negative correlation for all drugs except Cabozantinib. n = 27 for each drug. Data presented as mean ± SEM (A–C), dose response Growth Curves (GR) (D), Correlogram (E), linear regressions (F, G). Statistical analysis: Two-Way ANOVA followed by Bonferroni post hoc test (A–C), Pearson’s correlation (E–G). |