
Fig. 3
- ID
- ZDB-FIG-260423-3
- Publication
- Grassi et al., 2026 - Patient-Derived in Vitro Models Reveal Insights into Medullary Thyroid Cancer Microenvironment and Resistance to Tyrosine Kinase Inhibitors
- Other Figures
- All Figure Page
- Back to All Figure Page
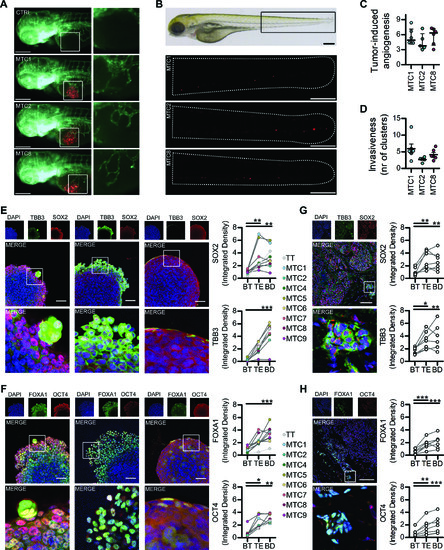
MTC lines have pro-angiogenic and invasive behavior in vivo and in vitro. (A, C) Representative fluorescence microscopy images of Tg(fli1a:EGFP)y1 zebrafish embryos and relative quantifications showing MTC cells xenograft (red) and vessels (green) one day post-injection. Inset highlights endothelial structures sprouting from the sub-intestinal vessels (SIV) plexus toward the tumor engraftment site. All images are oriented with the rostral end to the left and dorsal side at the top. Each dot represents an independent biological replicate; for each replicate, at least 20 embryos were analyzed. MTC1 n = 6, MTC2 n = 5, MTC8 n = 6. Scalebar 100 µm. (B, D) Representative brightfield and fluorescence microscopy images and relative quantifications showing spread of MTC cell clusters (red) in the tail region at 2 days post-injection. White dotted lines outline the embryo borders. All images are oriented with the rostral end to the left and dorsal side at the top. Each dot represents an independent biological replicate; for each replicate, at least 20 embryos were analyzed. MTC1 n = 6, MTC2 n = 5, MTC8 n = 6. Scalebar 100 µm. (E, F) Representative confocal microscopy images and relative signal intensity quantification of stem markers SOX2 and OCT4 and C-cells and neuroendocrine progenitors markers FOXA1 and TBB3 in invading spheroids bulk tumor (BT) vs. tumor edge (TE) and clusters of budding invasive cells (BD). Insets highlight invasive front areas, where a significant increase in the markers signal was detected in respect to the bulk tumor spheroid core. Each dot represents a different cell line. TT cells reference values are represented as gray diamonds and not included in the statistical analysis. n = 8. Scalebar 100 µm. (G, H) Representative confocal microscopy images and relative signal intensity quantification of stem markers SOX2 and OCT4, and neuroendocrine progenitor markers FOXA1 and TBB3 in MTC tissues bulk tumor (BT) vs. tumor edge (TE), and clusters of budding invasive cells (BD) in the MTC tissues cohort. Insets highlight the budding invasive cells area, where a significant increase in the markers signal was detected similar to that in invasive spheroids. n = 7. Scalebar 100 µm. Data presented as median ± IQR (C, D) and paired dot blot (E–H). Statistical analysis: Kruskal–Wallis (C, D); Repeated Measures ANOVA followed by Tukey’s Multiple Comparison Test (E–H). |