
FIGURE 8
- ID
- ZDB-FIG-260419-66
- Publication
- Ravishankar et al., 2026 - A Dynamic Change of Microglial States Occurs During the Transition From Photoreceptor Degeneration to Regeneration in Zebrafish pde6c Mutants
- Other Figures
- All Figure Page
- Back to All Figure Page
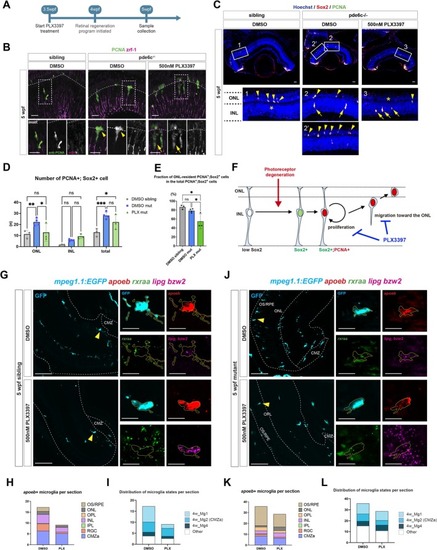
Distribution and classification of retinal microglia in DMSO or PLX3397‐treated wild‐type siblings and pde6c mutants. (A) Timeline of PLX3397 treatment in juvenile fish. (B) Five wpf retinas of wild‐type siblings treated with DMSO and pde6c mutants treated with DMSO or PLX3397, labeled with anti‐PCNA (green) and zrf‐1 (magenta) antibodies. Dotted lines indicate the OPL. Bottom panels show higher magnification images of proliferating Müller glia indicated by dotted rectangles in the top panel. In DMSO‐treated wild‐type siblings, proliferative Müller glia are sparse. In DMSO‐treated pde6c mutants, most proliferative Müller glia migrate to the ONL (yellow arrowheads). In PLX3397‐treated pde6c mutants, proliferative Müller glia are increased, but mostly located in the INL (yellow arrows). Scale bars: 20 μm. (C) Five wpf retinas of wild‐type sibling treated with DMSO and pde6c mutant treated with DMSO or PLX3397, labeled with anti‐PCNA (green) and anti‐Sox2 (red) antibodies. Nuclei are counterstained with Hoechst (blue). Bottom panels are higher magnification images of the rectangles shown in upper panels. Yellow arrows and arrowheads indicate Sox2 and PCNA‐double positive cells in INL and ONL, respectively. Scale bars: 30 μm. (D) Graph of the number of PCNA+; Sox2+ Müller glia in ONL, INL and both layers (total) per retinal section of DMSO‐treated wild‐type siblings and DMSO or PLX3397‐treated pde6c mutants. Each dot represents an average of 2–3 sections from one fish. Two‐way ANOVA with Sidak multiple comparison test: means ± SD, ns, p > 0.05; *p ≤ 0.05, **p ≤ 0.005; ***p ≤ 0.001. (E) Graph of the fraction of ONL‐resident PCNA+; Sox2+ Müller glia in the total PCNA+; Sox2+ Müller glia population. Two‐way ANOVA with Tukey multiple comparison test: means ± SD, ns, p > 0.05; *p ≤ 0.05. (F) A possible model of PLX3397‐mediated suppression of regeneration of Müller glia in pde6c mutants. PLX3397 may inhibit the proliferation rate of Müller glia or their migration toward the ONL, leading to the accumulation of proliferative Sox2+ Müller glia in the INL of pde6c mutants. (G) Retinal sections of 5 wpf Tg[mpeg1.1:EGFP] transgenic wild‐type zebrafish treated with DMSO or PLX3397. Dotted lines mark the retinal area. Arrowheads indicate a representative apoeb+ microglial cell, whose apoeb, rxraa, and lipg/bzw2 expression is visualized with HCR‐FISH and shown in magnified panels on the right. Scale bar: 50 μm for left large panels, 10 μm for magnified images. (H) Bar chart showing the distribution of apoeb+ microglia across retinal layers in wild‐type siblings. 4w_Mg cells localized in RGCL, INL, and OS/RPE are decreased in PLX3397 treated wild‐type siblings. (I) Bar chart showing classification of apoeb+ microglia into ‘4w_Mg1/CMZa‐resident 4w_Mg2/4w_Mg4’ or ‘Other’ clusters in wild‐type siblings. The 4w_Mg1 fraction is reduced by PLX3397 treatment. (J) Retinal sections of 5 wpf Tg[mpeg1.1:EGFP] transgenic pde6c mutant zebrafish treated with DMSO or PLX3397, as described in (G). (K) Bar chart showing the distribution of apoeb+ microglia across retinal layers in pde6c mutants. 4w_Mg cells localized in OS/RPE are decreased in PLX3397 treated pde6c mutants. (L) Bar chart showing classification of apoeb+ microglia into 4w_Mg1, CMZa‐resident 4w_Mg2, 4w_Mg4 or ‘Other’ cluster in pde6c mutants. The 4w_Mg1 fraction is maintained in the presence of PLX3397. On the other hand, the ‘Other’ fraction is reduced by PLX3397 treatment. |