
FIGURE 3
- ID
- ZDB-FIG-260419-61
- Publication
- Ravishankar et al., 2026 - A Dynamic Change of Microglial States Occurs During the Transition From Photoreceptor Degeneration to Regeneration in Zebrafish pde6c Mutants
- Other Figures
- All Figure Page
- Back to All Figure Page
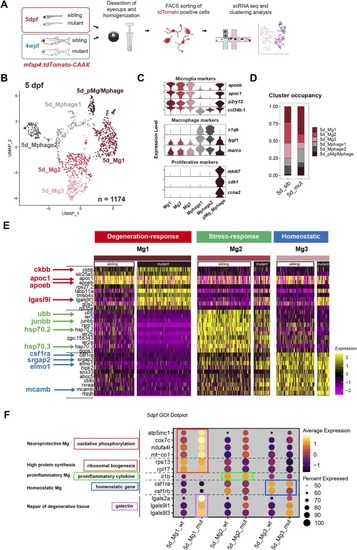
Identification of microglial clusters at the onset of photoreceptor degeneration. (A) Workflow of scRNA‐seq experiment using zebrafish retinas at 5 dpf and 4 wpf. (B) UMAP plot showing three microglial clusters, two macrophage clusters, and one proliferative microglia and macrophage‐mixed cluster at 5 dpf. Clustering resolution = 0.5. (C) Expression of microglia markers (apoeb, apoc1, p2ry12, ccl34b.1), macrophage markers (c1qb, lygl1, marco), and proliferative markers (mki67, cdk1, ccna2) per cluster at 5 dpf. (D) Fraction of each microglia and macrophage cluster in wild‐type siblings and pde6c mutants. (E) Heatmap of the top 10 enriched genes for each microglial cluster, 5d_Mg1/2/3, at 5 dpf. Wild‐type sibling and pde6c mutant cells are split for each subcluster. Degeneration‐response markers (ckbb, apoc1, apoeb, lgasl9l), stress‐response markers (ubb, junbb, hsp70.2, hsp70.3), and homeostatic markers (csf1ra, srgap2, elmo1, mcamb) are highlighted in red, green, and blue colors, respectively. (F) Dotplot analysis of genes related to oxidative phosphorylation (atp5mc1, cox7c, ndufa4l, mt‐co1), ribosomal biogenesis (rps13, rpl17), proinflammatory cytokine (il1b), homeostatic genes (csf1ra and csf1rb), and galectin genes (lgals2a, lgals9l1, and lgals9l3), which represent neuroprotective microglia, high protein synthesis, proinflammatory microglia, homeostatic microglia, and repair of degenerative issues, respectively. Microglial groups highly expressing each gene category are marked by color‐coded squares. |