FIGURE

FIGURE 7

ID
ZDB-FIG-260418-11
Publication
Nakatani et al., 2026 - Microbiota Composition Shaped by Seasonal Variation and Environmental Compartments Affects the Abundance of Antimicrobial-Resistant Bacteria in Indonesian Aquaculture
Other Figures
All Figure Page
Back to All Figure Page
FIGURE 7

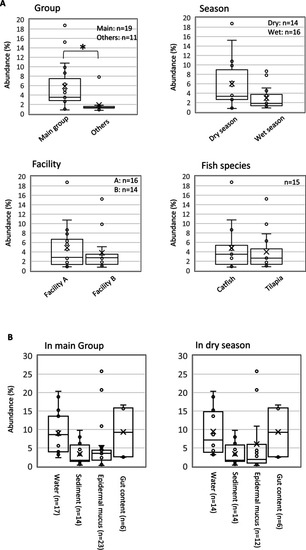
Comparison of potential tet‐resistant bacteria proportions in the bacterial flora of Indonesian aquaculture environments. (A) Based on the proportions of potential tet‐resistant bacteria detected in Figure 6, the total proportion of these bacteria was calculated for each sample and compared among bacterial flora groups (Figure 5), dry‐ and wet‐season samples, samples from Facilities (A) and (B), and samples from catfish and tilapia. The total proportions in each sample are shown as box plots. p < 0.01, Mann–Whitney U test. (B) Further comparisons were performed for the main group and for dry‐season samples, which tended to show higher proportions of potential tet‐resistant bacteria in panel A. Within each category, the total proportions were compared among sampling sites (gut content, epidermal mucus, water and sediment). Individual sample data from each site (Supporting Information: Sheet 2) were analysed in the same manner as in Figure 6.

Expression Data

Expression Detail
Antibody Labeling
Phenotype Data

Phenotype Detail
Acknowledgments
This image is the copyrighted work of the attributed author or publisher, and ZFIN has permission only to display this image to its users. Additional permissions should be obtained from the applicable author or publisher of the image. Full text @ Environ Microbiol Rep