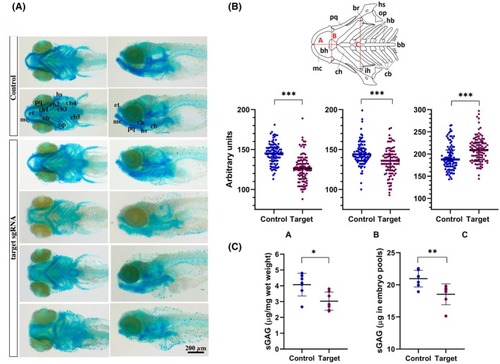
Alcian blue staining of cartilage and sGAG quantification. At 120 hpf, embryos without gross morphological alterations (as shown in Fig. 8B) underwent Alcian blue staining and whole‐mount stereomicroscopic analysis. (A) Ventral and lateral views revealed a spectrum of cartilage malformations in the sgRNA‐injected embryos (four lower panels) compared with the control embryos (two upper panels). These defects range from near‐normal cartilage to significant disruption of craniofacial structures. Cartilages are identified with the following abbreviation: bb, basibranchials; bh, basihyal; cb, ceratobranchial; ch, ceratohyal; hb, hypobranchial; hs, hysosymplectic; ih, interhyal; mc, Meckel's cartilage; op, opercle; pq, palatoquadrate. Scale bar = 200 μm. (B) A schematic of the 120 hpf zebrafish viscerocranium (ventral view) illustrates the cartilages analyzed for the morphometric measurements (red lines). The abbreviations are the same used in panel A. Morphometric analysis revealed a significant reduction in the development of Meckel's cartilage and the palatoquadrate (measurements A and B) and a wider angle between the ceratohyals (measurement C) in most injected larvae. Analysis was performed by Mann–Whitney test, n = 96 per group, ***P < 0.001; median with interquartile range is depicted. (C) Analysis using the DMMB colorimetric assay reveals a significant reduction in sulfated glycosaminoglycans (sGAG) levels in the embryos injected with the target sgRNA. Pools of 10 embryos each from control and targeting sgRNA‐injected animals were extensively digested with papain, and the released sGAG were quantified against a heparan sulfate standard curve. Results are expressed as μg of sGAG for mg of wet weight or as total sGAG content in the embryo pools. Analysis was performed by Welch t‐test, n = 8 per group, *P < 0.05; **P < 0.01; mean ± SD is depicted.
|
