
Fig. 5
- ID
- ZDB-FIG-260401-131
- Publication
- Dereddi et al., 2026 - Oligodendrocyte mechanotransduction channel TMEM63A regulates myelin sheath geometry
- Other Figures
- All Figure Page
- Back to All Figure Page
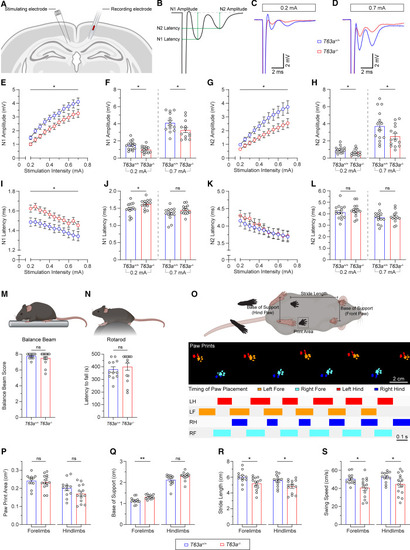
TMEM63A deficiency slows axonal conduction and impairs fine motor behavior (A) Axonal conduction measurements setup in the CC. (B) Typical callosal compound action potential (CAP) trace (black) with analyzed CAP parameters (green). (C and D) CAPs in 8-week-old T63a+/+ and T63a−/− mice in response to a 0.2 mA (C) and 0.7 mA (D) stimulus. (E–L) N1 (E) and N2 (G) amplitudes and N1 (I) and N2 (K) latencies in response to stimulation intensities between 0.2 and 0.7 mA in T63a+/+ (blue) and T63a−/− (red) mice. N1 (F) and N2 (H) amplitudes and N1 (J) and N2 latencies (L) in response to 0.2 mA (left) and 0.7 mA (right) stimulation. (M and N) Balance beam test with scores (1: worst and 8: best, M) and rotarod with latency to fall (N) in 2-month-old T63a+/+ and T63a−/− mice. (O) Features of gait parameters (stride length, base of support, and print area) on the CatWalk test (top) and sequence of right and left paw placements (bottom). Left hind (LH), left front (LF), right hind (RH), and right front (RF) paws. Colored lines, duration of paw placements. (P–S) Analysis of paw print area (P), base of support (Q), stride length (R), and swing speed (S) of fore- and hindlimbs. Data represent mean ± SEM. ns, non-significant; p > 0.05, ∗p < 0.05, ∗∗p < 0.01. See also Table S3 (sample sizes and statistical tests). |