FIGURE

Figure 3

ID
ZDB-FIG-260313-14
Publication
Tarahomi et al., 2025 - Transcriptomic identification and developmental mapping of nrg3b expression in zebrafish
Other Figures
All Figure Page
Back to All Figure Page
Figure 3

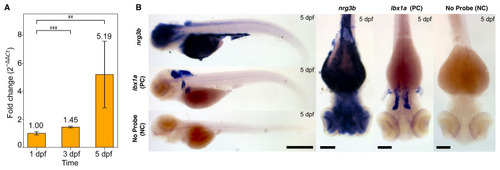
Validation of nrg3b expression at 5 dpf. A, RT-qPCR validation of nrg3b expression at 1, 3, and 5 dpf. Expression was normalized to day 1 using rpl13a as the reference gene. Data represent the mean fold-change ± SEM (n = 3 biological replicates × 3 technical replicates per time point). One-way ANOVA showed a significant effect of the developmental stage (F(2,24)=9.99, p < 0.001). Post hoc Dunnett’s test indicated significant upregulation on days 3 and 5 vs. day 1. B, Detection of nrg3b expression in embryos. WISH in 5 dpf zebrafish embryos using nrg3b, lbx1a (positive control (PC)), and no-probe (negative control (NC)). Lateral views (left) show whole-body expression; dorsal views (right) show the head region. Scale bars: 500 μm for the whole body, 100 μm for the dorsal views.

Expression Data
Genes:
Fish:
Anatomical Terms:
Stage Range: Prim-5 to Day 5

Expression Detail
Antibody Labeling
Phenotype Data

Phenotype Detail
Acknowledgments
This image is the copyrighted work of the attributed author or publisher, and ZFIN has permission only to display this image to its users. Additional permissions should be obtained from the applicable author or publisher of the image. Full text @ Turk J Biol