
FIGURE 6
- ID
- ZDB-FIG-260311-681
- Publication
- Lynch et al., 2026 - The Microbiota Shapes Central Nervous System Myelination in Early Life
- Other Figures
- All Figure Page
- Back to All Figure Page
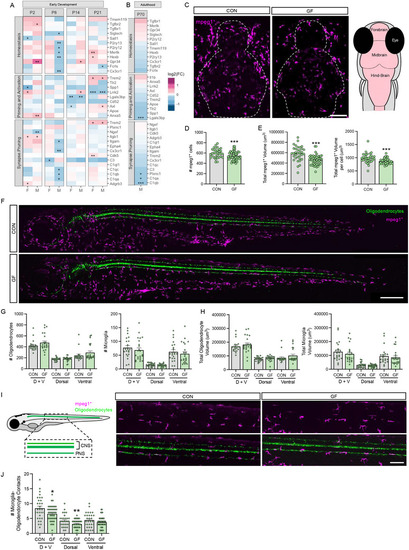
The microbiota modulates microglial homeostasis and localization across species. (A‐B) Heatmap showing the expression fold change (logFC) and significance of differentially expressed genes associated with microglia homeostasis, activation and priming, and synaptic pruning in germ‐free (GF) versus conventionally‐raised (CON) mice during (A) early development and (B) adulthood. Colour indicates logFC, with purple indicating increased expression and blue indicating decreased expression in GF mice compared to controls. (C) Representative images of microglia/macrophages (magenta; Tg(mpeg1:eGFP) in the head of GF and CON larvae at 5 dpf. Scale bar 50 µm. (D,E) Quantification of the total number of (D) mepg1+ cells and the (E) total area and total area occupied per mepg1+ cell within the head of GF and CON larvae at 5 dpf. (F) Representative images of mepg1+ cells (magenta; Tg(mpeg1:eGFP) and oligodendrocytes (green; Tg(mbp:mScarlet)) in the dorsal and ventral spinal cord of GF and CON larvae at 5 dpf. Scale bar 300 µm. (G) Quantification of the total number of oligodendrocytes and microglia within the dorsal and ventral spinal cord of GF and CON larvae at 5 dpf. (H) Quantification of the total volume of oligodendrocyte and microglia within the dorsal and ventral spinal cord of GF and CON larvae at 5 dpf. (I) Schematic illustrating the region of interest, with emphasis on the lateral and dorsal spinal tracts as well as the peripheral tract. (J) Representative images of microglia/macrophages (magenta; Tg(mpeg1:eGFP) and oligodendrocytes (green; Tg(mbp:mScarlet)) in the spinal cord of GF and CON larvae at 5 dpf. Scale bar 50 µm. (K) Quantification of the total number of microglia‐oligodendrocyte contacts within the dorsal and ventral spinal cord of GF and CON larvae at 5 dpf. Data presented as Mean ± SEM. Sample size: Adulthood: n = 8 mice/group, Early Development: n = 8–10 mice/group, Zebrafish Head: n = 33–47 larvae. Zebrafish whole spinal cord: n = 21–23 larvae, Zebrafish microglia‐oligodendrocyte contacts: n = 30–45 larvae, Microbiota; *p < 0.05, **p < 0.01, ***p < 0.001. Abbreviations: P: postnatal day, F: females, M: males, GF: germ‐free. Detailed statistical analysis can be found in Supplementary Table |