FIGURE

Figure 2

ID
ZDB-FIG-260311-648
Publication
Ujibe et al., 2026 - Deficiency of Werner RecQ-type DNA helicase causes premature malnutrition in zebrafish
Other Figures
All Figure Page
Back to All Figure Page
Figure 2

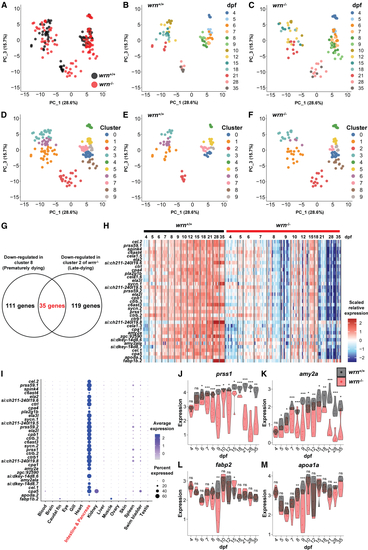
Expression of pancreatic cell and intestinal markers is decreased in zebrafish wrn-/-

(A) Principal component analysis (PCA) of the wrn+/+ and wrn-/- individuals, color-coded by genotype.

(B) PCA of the wrn+/+ individuals, colored by developmental stage.

(C) PCA of the wrn-/- individuals, colored by developmental stage.

(D) PCA based on clustering, color-coded by cluster identity.

(E) PCA of the wrn+/+ individuals, color-coded by cluster identity from Figure 2D.

(F) PCA of the wrn-/- individuals, color-coded by cluster identity from Figure 2D.

(G) Gene filtering strategy used to identify 35 genes that were specifically downregulated in wrn-/-.

(H) Heatmap of 35 genes downregulated in wrn-/- at both 7–9 and 21–35 dpf.

(I) Tissue-specific expression of 32 genes (excluding cela1.3, cela1.5, and cela1.6) based on the Zebrafish Cell Landscape.

(J–M) Expression of pancreatic exocrine cell and intestinal markers in wrn+/+ (black) and wrn-/- (red). Exocrine cell markers: prss1 (J) and amy2a (K); Intestinal markers: fabp2 (L) and apoa1a (M). Statistical significance was assessed using Welch’s t test at each time point. ∗p < 0.05, ∗∗p < 0.01, ∗∗∗p < 0.001, ns: not significant. The detailed p-values are shown in Table S5.

Expression Data

Expression Detail
Antibody Labeling
Phenotype Data

Phenotype Detail
Acknowledgments
This image is the copyrighted work of the attributed author or publisher, and ZFIN has permission only to display this image to its users. Additional permissions should be obtained from the applicable author or publisher of the image. Full text @ iScience