
FIGURE
FIGURE 4
- ID
- ZDB-FIG-260311-630
- Publication
- Whyte-Fagundes et al., 2025 - Zebrafish models of developmental epileptic encephalopathy accurately reflect clinical electrographic biomarkers
- Other Figures
- All Figure Page
- Back to All Figure Page
FIGURE 4
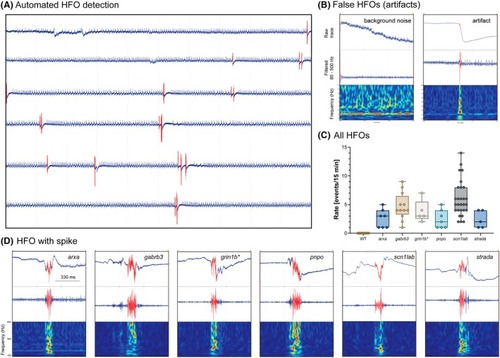
Automated detection and classification of high‐frequency oscillations (HFOs). (A) Representative LFP recording montage (15 min gap‐free, .5–1000 Hz); the short‐term energy HFO detector was applied in RippleLab to detect candidate HFO events (marked in red). (B) Events classified as artifact or background noise. (C) Box plots of HFO event rate quantified per single local field potential recording channel. (D) Representative events classified as HFO with spike for each genetic epilepsy zebrafish model. Shown are raw traces, filtered signals (80–500 Hz), and time–frequency plots. |
Expression Data
Expression Detail
Antibody Labeling
Phenotype Data
| Fish: | |
|---|---|
| Observed In: | |
| Stage: | Day 5 |
Phenotype Detail
Acknowledgments
This image is the copyrighted work of the attributed author or publisher, and
ZFIN has permission only to display this image to its users.
Additional permissions should be obtained from the applicable author or publisher of the image.
Full text @ Epilepsia