
FIGURE
FIGURE 1
- ID
- ZDB-FIG-260311-627
- Publication
- Whyte-Fagundes et al., 2025 - Zebrafish models of developmental epileptic encephalopathy accurately reflect clinical electrographic biomarkers
- Other Figures
- All Figure Page
- Back to All Figure Page
FIGURE 1
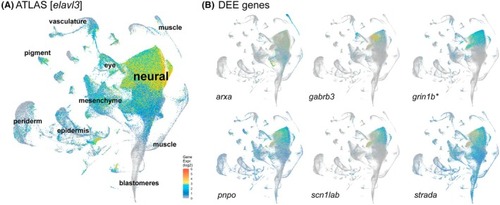
Uniform Manifold Approximation and Projection (UMAP) visualizations. (A) UMAP projection of cells, color coded by gene expression for elavl3, a neuron‐specific zebrafish gene. (B) UMAP projects for developmental epileptic encephalopathy genes. EMG, electromyogram; FFT, fast Fourier transform; HFO, high‐frequency oscillation; IED, interictal epileptiform discharge; LFP, local field potential; PCR, polymerase chain reaction. |
Expression Data
Expression Detail
Antibody Labeling
Phenotype Data
Phenotype Detail
Acknowledgments
This image is the copyrighted work of the attributed author or publisher, and
ZFIN has permission only to display this image to its users.
Additional permissions should be obtained from the applicable author or publisher of the image.
Full text @ Epilepsia