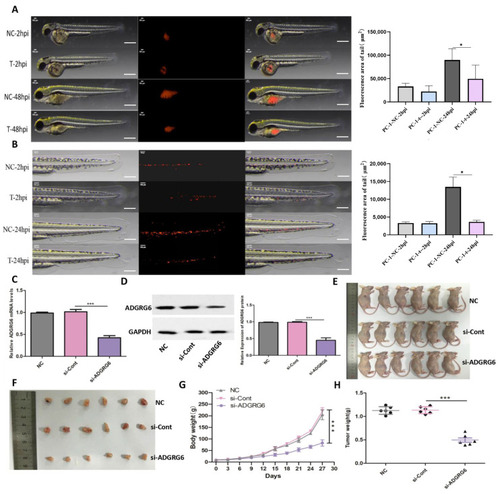
In vivo evidence of ADGRG6 oncogenic function in zebrafish and murine xenograft models. (A) Representative fluorescence microscopy images of zebrafish xenografts injected with CM-DiI-labeled AsPC-1 cells (si-NC vs. si-ADGRG6) at 48 h post-injection (hpi), showing reduced tumor fluorescence area in si-ADGRG6 xenografts. Scale Bar: 300 µm. (B) Migration distance of tumor cells in zebrafish xenografts at 24 hpi, significantly reduced upon ADGRG6 knockdown. Fluorescence (red) resulting from CM-Dil labeling was used to monitor the behavior of the cells in the zebrafish model. (C) Relative ADGRG6 mRNA and (D) protein levels in AsPC-1 cells transfected with siRNA. (E) Representative images of mice in vivo tumorigenesis assay. (F) Representative images of excised tumors from the tumor-bearing mice. (G) Body weight of mice across groups was measured every three days for each mouse and the growth curve was plotted (n = 6). (H) Comparison of the tumor weight (n = 6). Data are presented as Mean ± SD. Statistical analysis was performed using Student’s t-test for two-group comparisons and one-way ANOVA followed by Bonferroni’s post hoc test. * p < 0.05, *** p < 0.001.
|
