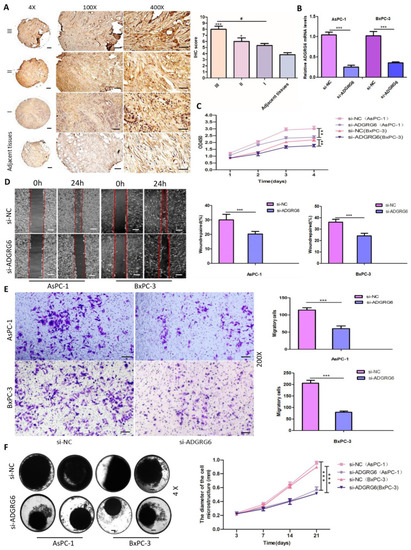
ADGRG6 silencing suppresses PAAD cell proliferation, migration, and invasion in vitro. (A) IHC staining of ADGRG6 in PAAD tissues based on tissue microarray analysis, showing higher expression in advanced TNM stages. Scale Bar: 200 µm. (B) ADGRG6 mRNA levels in AsPC-1 and BxPC-3 post si-ADGRG6. (C) Cell proliferation of si-ADGRG6-transfected AsPC-1 and BxPC-3 measured by CCK-8 assay. (D) Wound-healing assay demonstrating reduced migration capacity in si-ADGRG6-transfected AsPC-1 and BxPC-3 cells. Scale Bar: 50 µm. (E) Transwell invasion assays (200×) confirming decreased invasive ability post-knockdown. Scale Bar: 50 µm. (F) 3D spheroid culture assays demonstrating impaired spheroid growth in si-ADGRG6 cells, quantified by spheroid diameters across 21 days (4×). Scale Bar: 200 µm. Data are presented as Mean ± SD. Statistical analysis was performed using Student’s t-test for two-group comparisons and one-way ANOVA followed by Bonferroni’s post hoc test. “*” indicates comparison with the control group; “#” indicates significance between experimental groups (** p < 0.01, *** p < 0.001; # p < 0.05).
|
