|
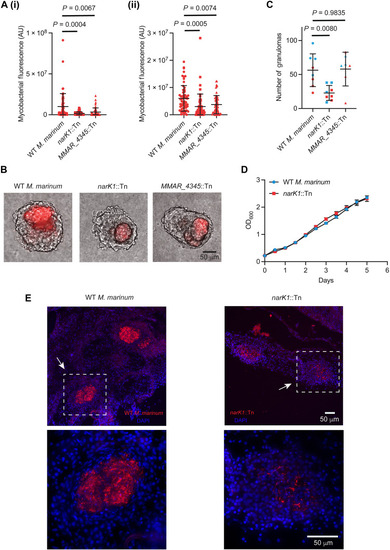
Mutations in granuloma-induced genes result in reduced bacterial burden within the granuloma necrotic core. (A) (i) and (ii): Bacterial burden in narK1::Tn-infected and MMAR_4345::Tn-infected granulomas compared with WT M. marinum granulomas from WT fish; mean arbitrary fluorescence units (AU). (i) and (ii): independent biological replicates. (i) WT M. marinum, n = 57; narK1::Tn, n = 59; MMAR_4345::Tn, n = 52 granulomas. Granulomas from four WT M. marinum–infected and narK1::Tn-infected fish each and three MMAR_4345::Tn fish. Brown-Forsythe and Welch ANOVA tests, followed by Dunnett’s T3 multiple comparisons test. (ii) WT M. marinum, n = 61; narK1::Tn, n = 52; MMAR_4345::Tn, n = 59 granulomas. Granulomas from three fish infected with WT M. marinum and from four fish infected with narK1::Tn and MMAR_4345::Tn each. One-way ANOVA followed by Sidak’s multiple comparisons test. Each point represents mycobacterial fluorescence in a single granuloma. (B) Images showing the burden of WT M. marinum, narK1, and MMAR_4345 mutants in WT granulomas. (C) Number of granulomas isolated from WT M. marinum–infected, narK1::Tn-infected, and MMAR_4345::Tn-infected fish, mean values. Data pooled from two independent experiments, differentiated by red and blue. Each point represents number of granulomas obtained from a single infected fish. n = 8 fish each for WT M. marinum and narK1::Tn infections and n = 7 fish for MMAR_4345::Tn infection. Ordinary one-way ANOVA followed by Dunnett’s multiple comparisons test. (D) In vitro growth profiles of WT M. marinum and narK1::Tn mutant. Data represent mean values from two biological replicates. (E) Representative fluorescent images of tissue sections containing granulomas (white boxes, white arrows; enlarged insets) from adult zebrafish infected with WT M. marinum or narK1::Tn (red), showing differences in bacterial burden. [(A), (C), and (D)] Error bars indicate SD. [(B) and (E)] Scale bars, 50 μm.
|