|
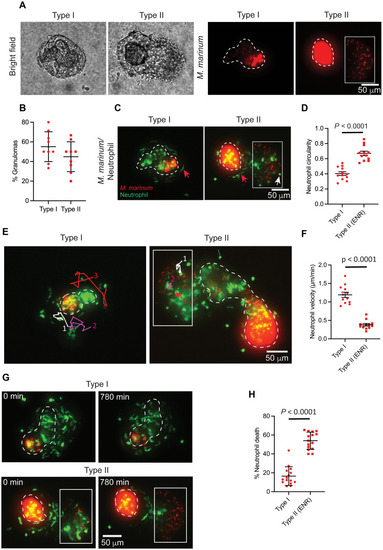
Neutrophil morphology, dynamics, and survival kinetics vary by granuloma subtype. (A) Representative images of granuloma explants from adult zebrafish infected with M. marinum (red). Two granuloma subtypes were defined by bacterial distribution. Dashed lines mark necrotic core boundaries. M. marinum outside the necrotic core in type II granulomas (ENR) indicated by the box. (B) Mean percentage of granuloma subtypes observed in granuloma explants with SD. Each point represents the percentage of granuloma subtype from a single experiment (9 independent experiments, 91 total granulomas, and 27 WT animals). (C) Images of granuloma explants from (A) showing altered neutrophil morphologies in granuloma subtypes. Neutrophils in green. Red arrows indicate elongated neutrophils; white arrows indicate rounded neutrophils. (D) Neutrophil shapes represented as mean circularity; error bars indicate SEM. Each point indicates mean neutrophil circularity from a single granuloma (306 neutrophils from 12 type I granulomas; 183 neutrophils from the ENR of 12 type II granulomas). Two-tailed, unpaired t test. (E) Neutrophils tracked for 230 min. (F) Mean neutrophil velocities in granuloma subtypes; error bars indicate SEM. Each point denotes mean velocity of five neutrophils tracked for 230 min from a single granuloma (60 neutrophils from 12 granulomas for each granuloma subtype). Unpaired t test with Welch’s correction. (G) Time-lapse images showing neutrophil viability in type I and the ENR of type II granulomas over 780 min. (H) Mean percentage neutrophil death observed in granuloma subtypes; error bars denote SD. Each point represents percentage of neutrophil death observed for 780 min in a single granuloma, n = 15 granulomas from each subtype; type I: 1080 neutrophils analyzed; type II (ENR): 532 neutrophils analyzed. Two-tailed, unpaired t test. [(D) to (H)] Data pooled from three independent experiments; total of nine animals. Images are 100-μm maximum projections. Scale bars, 50 μm.
|