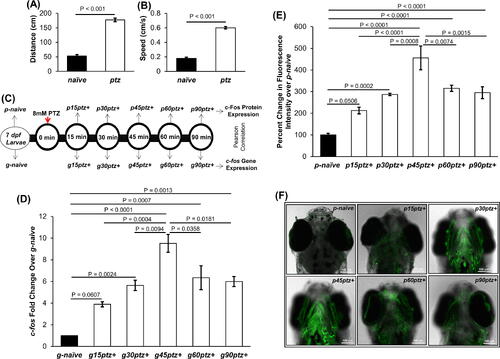
PTZ exposure at 8 mM induced hyperactive responses in zebrafish larvae at 7-dpf indicated by increased distance traveled (A) and mean velocity (B). A schematic representation of the experimental protocol with the time points of protein and gene expression analysis is shown in (C). There was an alteration in the c-fos gene expression in the larval cephalic region at different time intervals post the PTZ stimulus (D). Changes in the brain c-Fos protein expression were also observed at different time intervals following PTZ exposure in zebrafish larvae (E). A representative image of a larva from each group subjected to the whole-mount in situ c-Fos protein expression is shown in the figure (F). Statistical analysis of PTZ-mediated changes in distance traveled (A) and mean velocity (B) in comparison with the naive control was performed using an unpaired t-test. Whereas, statistical analysis of gene and protein expression results was performed by one-way ANOVA followed by Tukey’s multiple comparison post hoc test. All the results were represented as mean ± standard error of the mean.
|
