FIGURE

FIGURE 6

ID
ZDB-FIG-251216-24
Publication
Chen et al., 2025 - Ddx3xa mutations drive cardiac defects in a zebrafish model via dysregulation of wnt/β-catenin signaling
Other Figures
All Figure Page
Back to All Figure Page
FIGURE 6

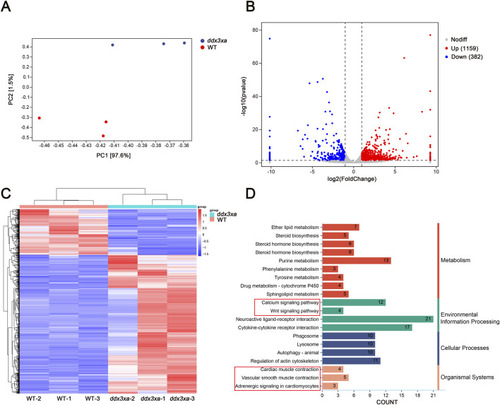
Transcriptomic alterations in ddx3xa−/− zebrafish at 72 hpf. (A) Principal component analysis (PCA) of the transcriptome revealed clear separation between WT and ddx3xa−/− groups along PC1, which accounted for 97.6% of the total variance (PC2: 1.5%). Sample distribution: wild-type (WT) controls (red) versus ddx3xa−/− mutants (blue). (B) Volcano plot of differentially expressed genes (DEGs): downregulated (blue), nonsignificant (gray), upregulated (red). (C) Hierarchical clustering heatmap: rows represent genes, columns represent samples. Expression levels scaled from high (red) to low (blue). (D) KEGG pathway enrichment analysis.

Expression Data

Expression Detail
Antibody Labeling
Phenotype Data

Phenotype Detail
Acknowledgments
This image is the copyrighted work of the attributed author or publisher, and ZFIN has permission only to display this image to its users. Additional permissions should be obtained from the applicable author or publisher of the image. Full text @ Front Mol Biosci