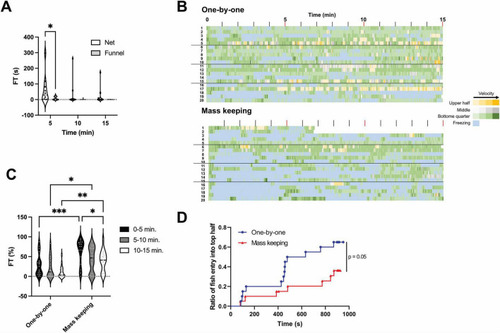
Effects of net-chasing on freezing time and exploratory behavior. (A) Freezing time (FT) measured in 5-min intervals during the novel tank diving test (NTT) using either a net or a funnel for fish transfer. During the first 5 min, FT was significantly higher in the net-transfer group than that in the funnel-transfer group (p < 0.05). Variability was significantly greater in the net-transfer group than in the funnel-transfer group across all time points (p < 0.05, F-test). The same individuals were used across all conditions (n = 10; 5 males and 5 females). *p < 0.05. (B) Heatmaps showing the spatial position and swimming speed of individual fish during a 15-min NTT following either one-by-one or mass breeding conditions. The colors represent the positional zones: yellow, gray, and green represent the upper half, middle half (second and third quartiles from the bottom), and bottom quarter of the tank, respectively. The color intensity reflects the swimming speed, with darker shades indicating faster movement. Freezing episodes are shown in light blue. The y-axis represents individual fish. The same population of fish was used in both the one-by-one and mass breeding conditions; however, the individual IDs do not correspond to the same fish across conditions. (C) FT measured in 5-min intervals corresponding to the conditions shown in (B). In all time intervals, FT was significantly higher in the mass breeding group than that in the one-by-one group. *p < 0.05, **p < 0.01, ***p < 0.001. (D) Kaplan–Meier curves showing the cumulative number of fish that entered the upper half of the tank for the first time over the course of the test, corresponding to the conditions in (B). For B–D, the same individuals were used across all conditions (n = 20; 10 males and 10 females).
|
