
Fig. 5
- ID
- ZDB-FIG-251107-50
- Publication
- Li et al., 2025 - Genetic regulation of ARID3B confers cleft lip with/without cleft palate susceptibility through LLPS-mediated transcriptional program
- Other Figures
- All Figure Page
- Back to All Figure Page
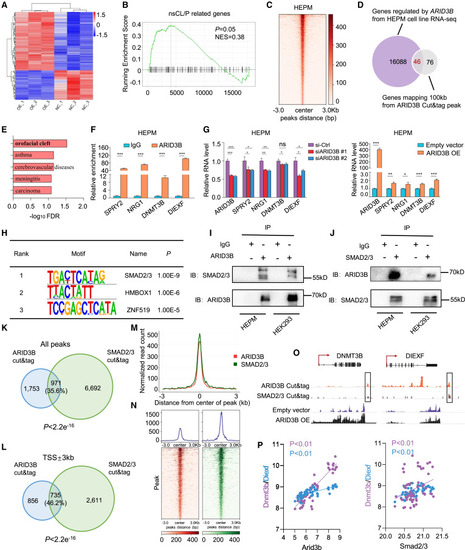
SMAD2/3 cooperates with ARID3B in transcriptional regulation (A) Heatmap plot of the 122 differentially expressed genes (DEGs) identified via RNA-seq. (B) Gene set enrichment analysis (GSEA) of nsCL/P risk genes. The gene sets were collected from the Jensen database. (C) Distribution of ARID3B cleavage under targets and tagmentation (Cut&Tag) reads and heatmap of binding signals around the 3 kb windows centered on the transcription start site (TSS) of genes. (D) Venn diagram showing 46 target genes according to integrated analyses of both the RNA-seq and Cut&Tag data. Based on the false discovery rate (FDR < 0.05), DEGs and genes mapping ±100 kb from the ARID3B Cut&Tag peaks were used to identify “overlapping” ARID3B target genes. (E) Disease pathway enrichment for the 46 ARID3B target genes whose orofacial cleft was the only significant disease in the Jensen database. (F) Representative genes from the orofacial cleft gene panel were validated through ChIP-qPCR using antibodies against ARID3B. (G) Representative genes from the orofacial cleft gene panel were validated through RT-qPCR after siRNA-mediated knockdown and plasmid overexpression. (H) The top three binding motifs and their binding transcription factors were identified via HOMER analysis. (I and J) Coimmunoprecipitation (co-IP) analysis of the interaction between endogenous SMAD2/3 and ARID3B in HEPM cells with anti-ARID3B (I) or anti-SMAD2/3 (J) antibodies. (K and L) Venn diagram showing the overlap of all SMAD2/3 and ARID3B Cut&Tag peaks (K) or the peaks at the transcription start site (TSS) ±3 kb (L). P values were calculated with Fisher’s exact test. (M) Average SMAD2/3 and ARID3B Cut&Tag signal intensities at ARID3B peaks. (N) Heatmap of binding signals co-occupied by SMAD2/3 and ARID3B around the 3 kb windows centered on the TSS of genes. (O) Genome browser tracks of SMAD2/3 Cut&Tag and ARID3B Cut&Tag and RNA-seq at the genomic loci of DNMT3B and DIEXF. (P) Correlation analysis of Dnmt3b and Diexf expression with Smad2/3 and Arid3b expression in embryonic craniofacial tissues from GSE67985. Data are presented as mean ± SEM (n = 3). ∗p < 0.05, ∗∗p < 0.01, and ∗∗∗p < 0.001. |