
Fig. 2
- ID
- ZDB-FIG-251107-47
- Publication
- Li et al., 2025 - Genetic regulation of ARID3B confers cleft lip with/without cleft palate susceptibility through LLPS-mediated transcriptional program
- Other Figures
- All Figure Page
- Back to All Figure Page
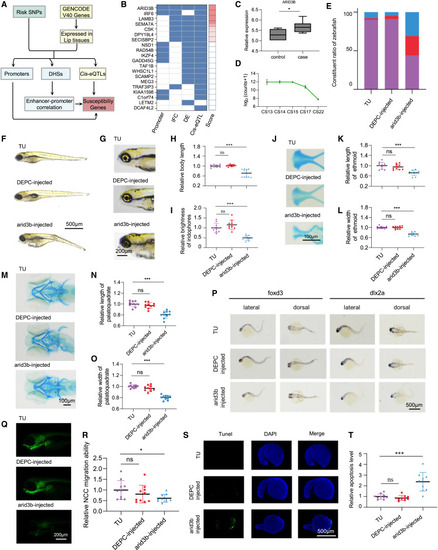
arid3b disrupts craniofacial development by impairing cranial neural crest cell (CNCC) migration (A) Flowchart of the integrative analysis approach. (B) List of the top 20 candidate genes. The blue and white boxes correspond to the presence or absence of each factor: risk SNP in the promoter (Promoter), high intercellular functional correlation (IFC), differential expression (DE; GSE42589), and eQTL with one or more risk SNPs (cis-eQTL). (C) Expression of ARID3B in healthy control and nsCL/P samples from GSE42589 (7 nsCL/P cases vs. 6 healthy controls). (D) Expression of ARID3B in human embryonic craniofacial tissues from GSE197513. (E) Bar plot showing the proportions of normal, abnormal, and dead zebrafish embryos. (F) Representative bright field images of zebrafish phenotypes with the indicated constructs. Scale bars, 500 μm. (G) Representative images of eye iridophores at 120 hpf. Scale bar, 200 μm. (H and I) Quantification of body length (H) and eye iridophores (I) at 120 hpf (n = 10). (J) Ventral view of zebrafish ethmoids via Alcian blue staining at 120 hpf. Scale bar, 100 μm. (K and L) Quantification of ethmoid length (K) and width (L) at 120 hpf (n = 10). (M) Zebrafish embryos at 120 hpf were stained with Alcian blue to observe jaw morphology structures with the indicated constructs. Scale bar, 100 μm. (N and O) Quantification of palatoquadrate length (N) and width (O) at 120 hpf (n = 10). (P) In situ hybridization assays showing the expression of marker genes related to CNCC migration. Scale bar, 500 μm. (Q) Lateral views of 120 hpf Tg (sox10:egfp) zebrafish embryos. Scale bar, 200 μm. (R) Quantification of the green fluorescent protein intensity (sox10:egfp) is shown (n = 10). (S and T) TUNEL staining revealed that there were more apoptotic cells in the arid3b-injected groups than in the negative control group (n = 10). Scale bar, 500 μm. Data are presented as mean ± SEM (n = 3). ∗p < 0.05 and ∗∗∗p < 0.001; ns, not significant. |