
FIGURE
Fig. 4f
- ID
- ZDB-FIG-251024-44
- Publication
- Qing Ji et al., 2024 - Molecular Characterization, Phylogeny, and Expression Profiles of SoxE Subfamily in Scophthalmus maximus
- Other Figures
- All Figure Page
- Back to All Figure Page
Fig. 4f
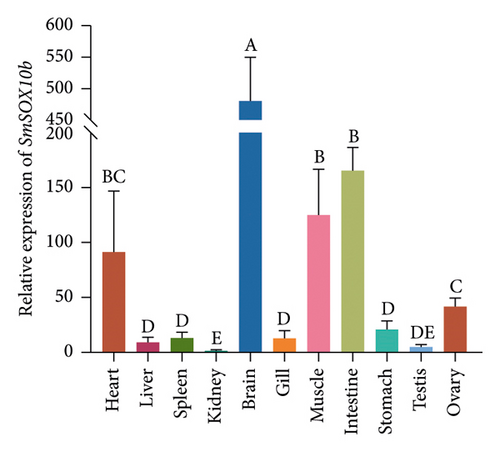
Spatial expression patterns for six SoxE genes in 11 tissues. The expression of one gene was determined on the basis of its minimum expression level across diverse tissues. Vertical bars indicate the mean ± S.E. P values were determined using the SPSS 20.0 through an independent sample t-test. Different letters represent statistical significance (P < 0.05) or the common letters across diverse groups represent nonsignificance. |
Expression Data
Expression Detail
Antibody Labeling
Phenotype Data
Phenotype Detail
Acknowledgments
This image is the copyrighted work of the attributed author or publisher, and
ZFIN has permission only to display this image to its users.
Additional permissions should be obtained from the applicable author or publisher of the image.
Full text @ Zeitschrift Angew. Ichthyol. (J. Appl. Ichtyol.)