
Fig. 6
- ID
- ZDB-FIG-251003-36
- Publication
- Lemée et al., 2025 - Disrupted transcriptional networks regulated by CHD1L during neurodevelopment underlie the mirrored neuroanatomical and growth phenotypes of the 1q21.1 copy number variant
- Other Figures
- All Figure Page
- Back to All Figure Page
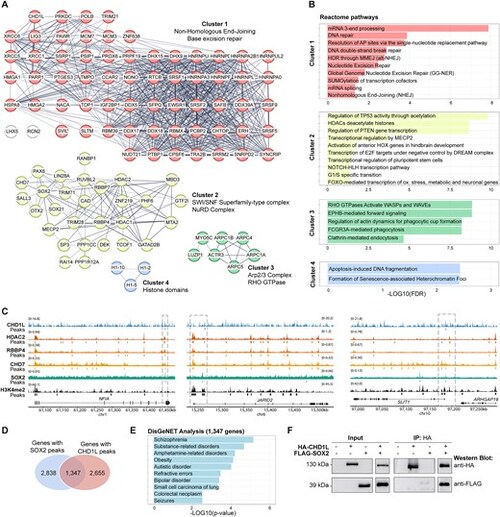
Immunoprecipitation and mass-spectrometry define CHD1L interactome and reveal developmental partners in hNPC. (A) STRING analysis of 104 nuclear proteins co-immunoprecipitated with CHD1L in hNPC extracts. Protein–protein interactions are shown (Protein-Protein interaction (PPI) enrichment P-value < 1e−16) and annotated according to functional clusters: Cluster 1 (63 proteins), Cluster 2 (29 proteins), Cluster 3 (7 proteins), Cluster 4 (3 proteins). (B) Gene ontology analyses showing reactome pathways enriched for each cluster. (C) Representative co-localization of CHD1L, HDAC2 (SRX19212560), RBBP4 (SRX19212562), SOX2 (SRX330107), CHD7 (SRX9795022), and H3K4me2 peaks on neuro-developmental genes (NFIA, JARID2, SLIT1) in human neural cells. (D) Venn diagram of SOX2 target genes (SRX330107) and CHD1L target genes showing an overlap of 1347 genes. (E) DisGeNET analysis of the common 1347 SOX2 and CHD1L target genes showing enrichment in human neurodevelopmental disorders. (F) Representative western blot of CHD1L and SOX2 co-immunoprecipitation in transfected HEK cells. |