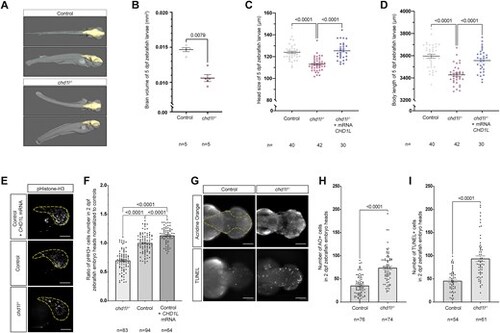
Loss of chd1l recapitulates mirrored neuroanatomical phenotypes of the 1q21.1 distal deletion in zebrafish. (A) 3D reconstitution of 5 dpf control and chd1l−/− zebrafish larvae acquired by HREM. The brain volume is shown in yellow. (B) Dot plot showing the quantification of brain volume of 5 dpf control and chd1l−/− zebrafish larvae. Data shown as mean ± SEM of a representative batch; Student’s t-test. (C, D) Dot plot showing the rescue of chd1l−/- phenotypes for head size and body length upon injection of CHD1L mRNA (100 pg) in chd1l −/− larvae compared to control larvae at 5 dpf, respectively. Data shown as mean ± SEM of triplicate batches; ordinary one-way ANOVA. (E) Lateral views of 2 dpf zebrafish heads for mutant chd1l−/−, control and CHD1L mRNA-injected larvae stained with phospho-histone H3 (pHH3; M-phase marker). Dotted yellow lines indicate quantified head areas. (F) Dot plot showing the pHH3 ratio of proliferating cells in the heads of 2 dpf chd1l−/− and CHD1L mRNA-injected larvae normalized to control. Data shown as mean ± SEM of triplicate batches; ordinary one-way ANOVA. (G) Dorsal views of 2 dpf heads of control and chd1l−/- mutant larvae stained with Acridine Orange (AO) or TUNEL. Dotted yellow line indicates quantified head area. (H) Dot plot showing the number of AO-positive cells in the heads of 2 dpf control and chd1l−/− mutant larvae. Data shown as mean ± SEM of triplicate batches; Mann–Whitney test. (I) Dot plot showing the number of TUNEL-positive cells in the heads of 2 dpf control and chd1l−/− mutant larvae. Data shown as mean ± SEM of triplicate batches; Mann–Whitney test. To simplify the visualization of the data, the nonsignificant P-values are not showed on the graphs. Scale bars: 100 μm.
|
