
Fig. 3
- ID
- ZDB-FIG-250905-75
- Publication
- Zhang et al., 2025 - Adaptive loss of shortwave-sensitive opsins during cartilaginous fish evolution
- Other Figures
- All Figure Page
- Back to All Figure Page
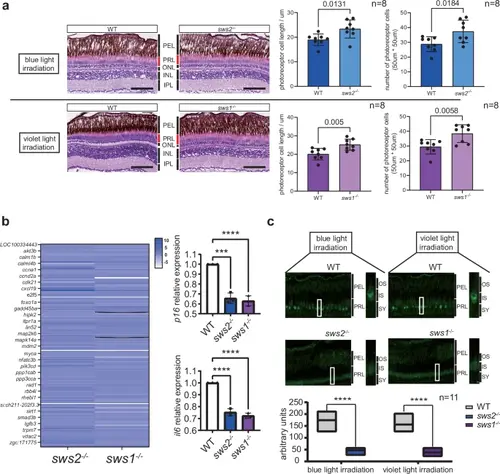
SWS-dependent retina injury and cell aging in zebrafish eyes after shortwave light irradiation. a Statistical results of the numbers and lengths of photoreceptor cells in wild type (WT) and sws2−/− zebrafish after exposure to blue (λmax = 420 nm) and violet (λmax = 370 nm) light. Two-sample two-sided unpaired t test: p = 0.0131, 95% CI = [1.081, 7.737], mean diff. = 4.409 ± 1.552, df = 14, t = 2.841, R² = 0.3657; p = 0.0184, 95% CI = [1.691, 15.56], mean diff. = 8.625 ± 3.233, df = 14, t = 2.668, R² = 0.3370; p = 0.0050, 95% CI = [1.806, 8.379], mean diff. = 5.093 ± 1.533, df = 14, t = 3.323, R² = 0.4409; p = 0.0058, 95% CI = [3.016, 14.73], mean diff. = 8.875 ± 2.732, df = 14, t = 3.249, R² = 0.4299. Data are from 8 samples per group, no adjustments were made for multiple comparisons. Data are representative of three independent experiments. Source data are provided as a Source Data file. b Transcriptomic expression heatmaps of sws2−/− compared to WT zebrafish exposed to blue light, and of sws1−/− compared to WT zebrafish after violet light irradiation. In total, 94 and 97 cell-aging-related genes were upregulated, 97 and 92 genes were down regulated in the sws2−/− and sws1−/− mutants, respectively. Some of the cell-aging-related genes are shown in the Y-axis. One-way ANOVA: F(2, 6) = 71.87, p < 0.0001, R² = 0.9599; Dunnett’s multiple comparisons test: WT vs. sws2-/-: mean diff. = 0.3434, 95% CI = [0.2448, 0.4420], adjusted p = 0.0001, ***; WT vs. sws1-/-: mean diff. = 0.3701, 95% CI = [0.2716, 0.4687], adjusted p < 0.0001, ****.One-way ANOVA: F(2, 6) = 160.1, p < 0.0001, R² = 0.9816; Dunnett’s multiple comparisons test: WT vs. sws2-/-: mean diff. = 0.2470, 95% CI = [0.1984, 0.2956], adjusted p < 0.0001, ****; WT vs. sws1-/-: mean diff. = 0.2762, 95% CI = [0.2276, 0.3247], adjusted p < 0.0001, ****. Data are from 3 replicates per group and representative of three independent experiments. Source data are provided as a Source Data file. c Immunofluorescent signal for P16 in the inner segment of the retina. Two-sample two-sided unpaired t test: p < 0.0001, 95% CI = [−144.7, −105.1], mean diff. = −124.9 ± 9.492, df = 20, t = 13.16, R² = 0.8965; two-sample two-sided unpaired t test: p < 0.0001, 95% CI = [−132.9, −93.42], mean diff. = −113.2 ± 9.474, df = 20, t = 11.95, R² = 0.8771. Data are from 11 samples per group and representative of three independent experiments, no adjustments were made for multiple comparisons. Source data are provided as a Source Data file. PEL pigment epithelial layer, PRL photoreceptor layer, ONL outer nuclear layer, INL inner nuclear layer, IPL inner plexiform layer, OS outer segment, IS inner segment, SY synapse. |