|
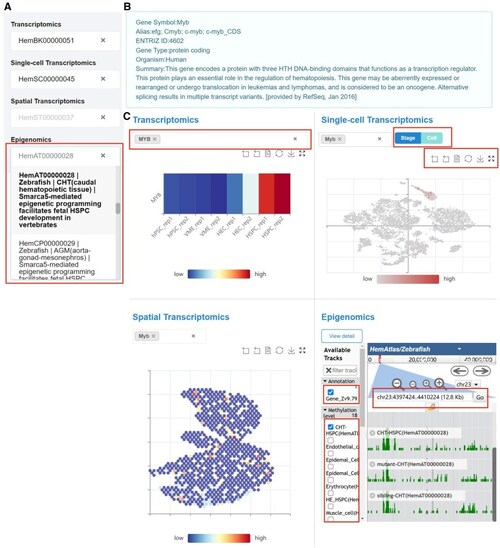
Omics module of HemAtlas A. Screenshot of the HemAtlas dataset selection. The red box illustrates a demonstration of the available datasets for the specific omics type (epigenomics). B. Detailed description of the gene MYB in human. The gene descriptions provided by HemAtlas are based on the RefSeq in the NCBI database (https://www.ncbi.nlm.nih.gov/refseq/). C. Upper left: visualization of MYB in the selected bulk RNA-seq dataset (HemBK00000051) from HSPC in vitro culture system [54]. The red box highlights the region where the gene search was conducted. The color of the bar represents the gene expression level. Upper right: visualization of Myb in the selected scRNA-seq dataset (HemSC00000045) from mouse AGM [23]. The upper red box highlights the region where cell annotation based on cell type or stage was conducted, while the lower red box indicates the area where additional online operations can be performed, such as zooming in on the webpage and downloading research results. Lower left: visualization of Myb in the selected spatial transcriptomics dataset (HemST00000037) from mouse FL [30]. The color of the bar represents the gene expression level. Lower right: visualization of myb in the selected ATAC-seq dataset (HemAT00000028) from zebrafish CHT HSPCs [55]. The red boxes highlight the areas where users can perform additional online operations, such as selecting reference versions, sequencing samples, and choosing genes. NCBI, National Center for Biotechnology Information; RefSeq, Reference Sequence Database.
|