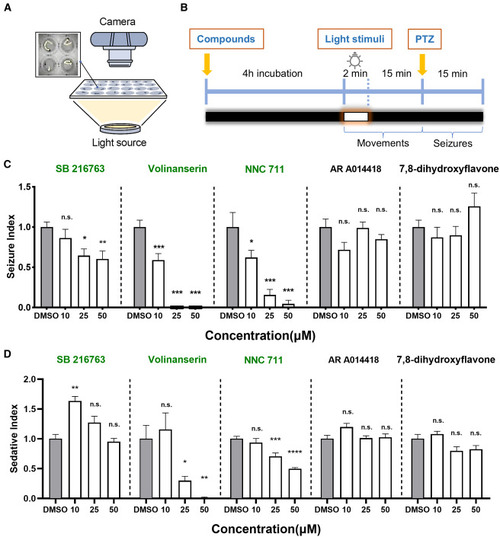
Validation of predicted anti-epileptic compound by in larval zebrafish (A) Schematic of the setup for the behavioral monitoring and testing in larval zebrafish. (B) The experimental protocol for therapeutic insulation (predicted compounds), seizure induction, and locomotive stimulation in zebrafish larvae. Following a 4-h drug exposure, the zebrafish larvae received a 2-min light stimulation, which typically elicits a rapid increase in their movement for the following 15 min; failure to exhibit this agitated moving pattern suggests the larva was sedated. Afterward, PTZ was applied for seizure induction, and the number of seizures per larva and the average seizure frequency at each concentration were quantified for 15 min post-PTZ exposure. (C) The seizure counts for the tested compounds (SB 216763, Volinanserin, NNC 711, AR A014418, and 7,8-dihydroxyflavone) at different concentrations (10, 25, and 50 μM). (D) Quantification of the sedative index for the tested compounds was calculated by taking the inverse of change in moving distance before and after light stimulation. For (C) and (D), successful prediction was shaded in light green, larva pre-treated with DMSO were used as a control. “n.s.” stands for no significant difference, error bars indicate s.e.m., n = 12, ∗∗∗∗p < 0.0001, ∗∗∗p < 0.001, ∗∗p < 0.01, ∗p < 0.05 by one way ANOVA.
|
