
Fig. 3
- ID
- ZDB-FIG-250725-30
- Publication
- Nobilleau et al., 2025 - RFC1 regulates the expansion of neural progenitors in the developing zebrafish cerebellum
- Other Figures
- All Figure Page
- Back to All Figure Page
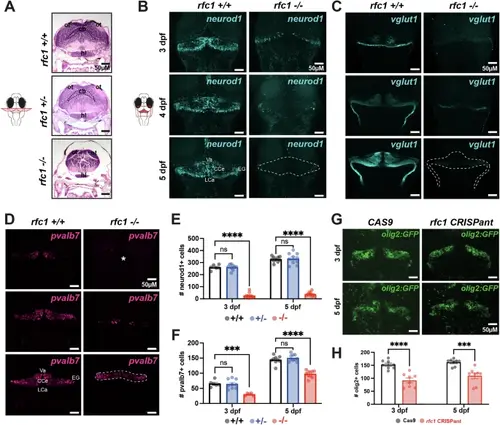
Rfc1−/− zebrafish larvae exhibit severe cerebellar defects.A Hematoxylin and eosin-stained transverse section of 5 days post-fertilization (dpf) zebrafish larvae at the level of the hindbrain, showing cerebellar hypoplasia in rfc1−/− larvae compared to wild-type (n = 3) and heterozygous (n = 5) siblings. ot optic tectum, cb, cerebellum, hl hypothalamus. B–D Immunostaining for cerebellar cell types in wild-type and rfc1−/− larvae at 3, 4, and 5 dpf. B Granule cells labeled with anti-Neurod1 antibody. C Granule cell axonal projections labeled with anti-Vglut1 antibody (at 3 dpf n = 6 rfc1+/+, 8 rfc1−/−; at 4 dpf n = 5 rfc1+/+, 6 rfc1−/−; and at 5 dpf n = 7 rfc1+/+, 17 rfc1−/−). D Purkinje cells labeled with anti-Parvalbumin7 (Pvalb7) antibody. Dotted lines outline the cerebellar structures, highlighting cerebellar loss at 5 dpf in rfc1−/− larvae. Asterisks indicate regions of cell loss. E, F Quantification of Neurod1-positive (E, at 3 dpf N = 2, n = 6 rfc1+/+, 9 rfc1+/−, 11 rfc1−/− and at 5 dpf N = 2, n = 10 rfc1+/+, 10 rfc1+/−, 10 rfc1−/−) and Pvalb7-positive (F, at 3 dpf N = 2, n = 6 rfc1+/+, 9 rfc1+/−, 5 rfc1−/− = 5, and at 5 dpf N = 2, n = 9 rfc1+/+, 10 rfc1+/−, 10 rfc1−/−) cells at 3 and 5 dpf in rfc1+/+, rfc1+/–, and rfc1−/− larvae. G Confocal imaging of transgenic [olig2:GFP] zebrafish larvae injected with Cas9 (control) or CRISPR targeting rfc1 (CRISPant) at 3 and 5 dpf, showing reduced olig2+ cell populations in CRISPants. H Quantification of olig2-positive cells in Cas9 and rfc1 CRISPant larvae (N = 2, at 3 dpf n = 8 Cas9, 9 rfc1 CRISPant and at 5 dpf n = 8 Cas9, 8 rfc1 CRISPant). Data in (E, F, H) are presented as mean ± SEM; individual dots represent biological replicates. Statistical analysis: one-way ANOVA with multiple comparisons (E, F) or unpaired t-test (H). ns, not significant (p > 0.05); * (p ≤ 0.05); ** (p ≤ 0.01); *** (p ≤ 0.001); **** (p ≤ 0.0001). Va valvula cerebelli, CCe corpus cerebelli, LCa lobus caudalis cerebelli, EG eminentia granularis. Scale bars: 50 μm (A–G). |