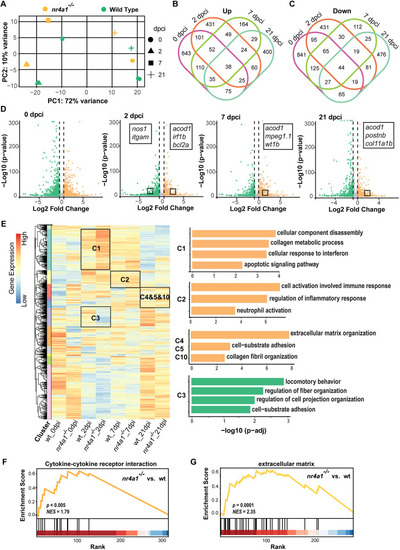
Upregulation of inflammation-, fibrosis- and apoptosis-related genes in nr4a1 mutant revealed by transcriptomic analysis. (A) Principal component analysis (PCA) plots represent the gene expression in hearts at different time points. (B,C) Venn diagrams of the upregulated (B) or downregulated (C) differentially expressed genes (DEGs) between control and mutant hearts from different stages after cryoinjury. (D) Volcano plots showing the DEGs at different stages after injury. Some representative genes are marked. Orange dots: upregulated DEGs in nr4a1 mutant; green dots: downregulated DEGs in nr4a1 mutant; log2 fold change ≥0.5; adjusted P-value<0.05. Color intensity represents the density of points in the volcano plot. (E) Hierarchical clustering heatmap of the comparatively DEGs in control and nr4a1 mutant hearts. A total of 12 clusters were generated, and cluster-enriched genes involved in their predicted GO biological processes were listed in the right panels. (F) Gene set enrichment analysis (GSEA) plots of DEGs encoding cytokine-cytokine receptor interaction linked with ablation of nr4a1 at 21 dpci. (G) GSEA plots of DEGs encoding ECM linked with deletion of nr4a1. The barcode plot indicates the positions of genes ranked by relevance, with red and blue colors denoting upregulation or downregulation, respectively, in the mutant fish hearts.
|
