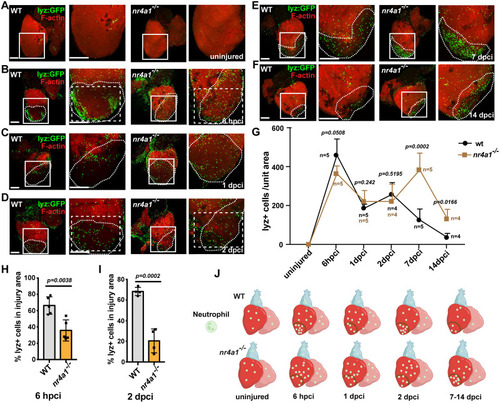
Defective neutrophil migration in nr4a1 mutant. (A-F) Left: distribution of neutrophils in uninjured wild-type (WT) hearts and WT hearts at 6 hpci and 1, 2,7, and 14 dpci. Right: distribution of neutrophils in uninjured nr4a1 mutant hearts and nr4a1 mutant hearts at 6 hpci and 1, 2,7, and 14 dpci. Boxed regions show the approximate positions for cell number quantification, and position of magnified images. Dashed box regions show the approximate positions of neutrophils around the wounded area. (G) Temporal dynamics of neutrophil number across multiple time points. Individual sample numbers (n) are indicated on the plot. (H,I) Percentage of neutrophil numbers in the wounded area per unit square area. (J) Schematic depicting the temporal dynamics of neutrophil number during heart regeneration. Created in BioRender by Feng, D., 2025. https://BioRender.com/vyhyvzk. This figure was sublicensed under CC-BY 4.0 terms. P-values<0.05 were considered statistically significant (two-tailed unpaired t-test, G). Data are mean±s.e.m. Scale bars: 275 µm.
|
