
Fig. 2
- ID
- ZDB-FIG-250702-42
- Publication
- Han et al., 2025 - Novel roles for CREG1 in hematopoiesis revealed by single-cell RNA sequencing
- Other Figures
- All Figure Page
- Back to All Figure Page
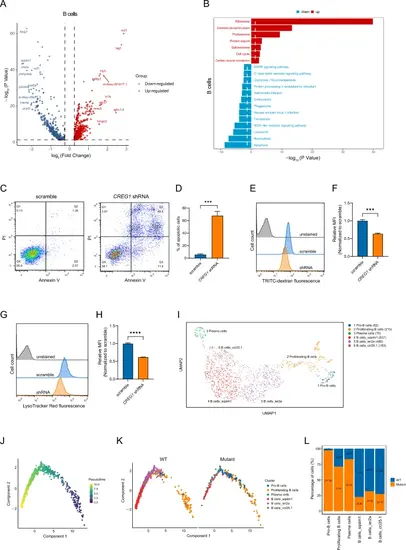
Comparative analysis of B cells between WT and creg1−/− fish. A Volcano diagram showing the DEGs in B cells between WT and creg1−/− fish. B KEGG pathway enrichment analysis of DEGs in B cells between WT and creg1−/− fish. C FACS analysis of U2932 cell apoptosis via Annexin V/PI staining. D Quantification of the percentage of Annexin V-positive U2932 cells of C. E FACS analysis of U2932 cell endocytosis via TRITC-dextran staining. F Quantitative analysis of TRITC-dextran mean fluorescence intensity (MFI) of E. G FACS analysis of U2932 cell lysosomal activity via LysoTracker Red staining. H Quantitative analysis of LysoTracker Red MFI of G. I UMAP plot showing unsupervised subclustering of B cells from both WT and creg1−/− kidney marrow. J, K Pseudotime trajectory analysis of B subclusters. L Fraction of each subcluster of B cells between WT and creg1−/− fish. Data shown are the mean ± SEM. Statistical significance was calculated using the Student's t-test. ***p < 0.001; ****p < 0.0001 |