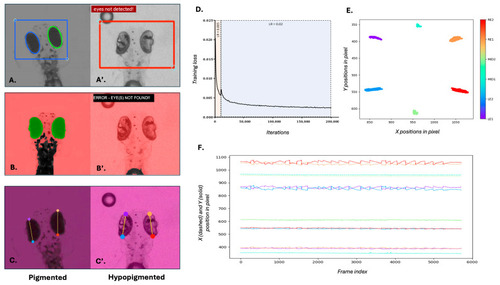
Comparison of eye tracking performance and model training using traditional and deep learning methods. (A–C) Eye detection and tracking in wild-type 5 dpf zebrafish larvae using (A) Stytra, (B) OKRtrack and (C) DeepLabCut (DLC). (A’–C’) Eye detection and tracking in slc45a2 hypopigmented larvae using the same three methods. (A’,B’) failed to detect the eye in hypopigmented larvae, as indicated by error messages and absence of overlays. In contrast, DLC (C’) successfully identified key anatomical landmarks across pigmentation levels. (D) Training loss curve over 200,000 iterations during DLC model training. The black line represents the training loss; shaded areas represent the two different learning rates. The plot shows a steep initial decline in the training loss, indicating rapid learning. As training progresses, the rate of decline slows down and the training loss gradually converges, suggesting that the model is approaching its optimal performance. (E) Cluster plot showing relative positions of tracked landmarks across the visual stimulus duration. Colours correspond to specific key points annotated for left eye (LE1, LE2), right eye (RE1, RE2) and mid-body (MID1, MID2) as indicated in the colour bar. Eye landmarks show high positional changes to the visual stimulus, while body landmarks remain stable. (F) Time-series plot of X (dashed lines) and Y (solid lines) positions of all six landmarks across frames. Midline body points remain relatively stable, while eye landmarks exhibit characteristic OKR waveforms in response to the visual stimulus.
|
