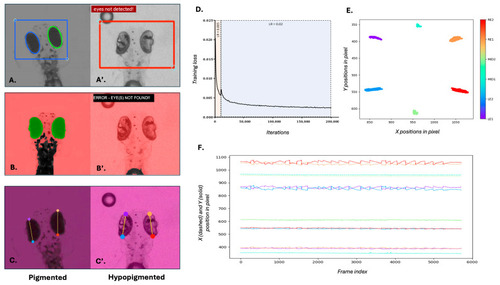
Comparison of eye tracking performance and model training using traditional and deep learning methods. (A–C) Eye detection and tracking in wild-type 5 dpf zebrafish larvae using (A) Stytra, (B) OKRtrack and (C) DeepLabCut (DLC). (A’–C’) Eye detection and tracking in slc45a2 hypopigmented larvae using the same three methods. (A’,B’) failed to detect the eye in hypopigmented larvae, as indicated by error messages and absence of overlays. In contrast, DLC (C’) successfully identified key anatomical landmarks across pigmentation levels. (D) Training loss curve over 200,000 iterations during DLC model training. The black line represents the training loss; shaded areas represent the two different learning rates. The plot shows a steep initial decline in the training loss, indicating rapid learning. As training progresses, the rate of decline slows down and the training loss gradually converges, suggesting that the model is approaching its optimal performance. (E) Cluster plot showing relative positions of tracked landmarks across the visual stimulus duration. Colours correspond to specific key points annotated for left eye (LE1, LE2), right eye (RE1, RE2) and mid-body (MID1, MID2) as indicated in the colour bar. Eye landmarks show high positional changes to the visual stimulus, while body landmarks remain stable. (F) Time-series plot of X (dashed lines) and Y (solid lines) positions of all six landmarks across frames. Midline body points remain relatively stable, while eye landmarks exhibit characteristic OKR waveforms in response to the visual stimulus.
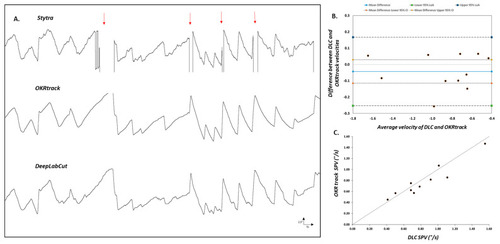
Comparison of eye tracking using traditional software and the DeepLabCut model. (A) Representative eye movement traces of larval zebrafish recorded during the optokinetic reflex (OKR) assay and analysed using three different pipelines: Stytra (top), OKRtrack in MATLAB (middle) and DeepLabCut (bottom). Stytra traces show missing segments (highlighted by red arrows), likely due to its reliance on image contrast thresholds and elliptical shape fitting. In contrast, both OKRtrack and DLC produce smoother and more complete traces of eye position over time, with consistent tracking of the slow-phase and saccadic components of the OKR. (B) Bland–Altman agreement plot comparing OKRtrack and DLC models. Each point represents the difference in slow-phase eye velocity between the two methods plotted against the mean value. The solid blue line denotes the mean difference (−0.043), while the outer dashed lines represent the 95% limits of agreement (−0.25 to 0.16), indicating good concordance between the methods. (C) Scatter plot comparing absolute slow-phase eye velocity values calculated by DeepLabCut (DLC) and OKRtrack for each fish. The diagonal line represents the line of identity (y = x), indicating perfect agreement. The results support the interchangeable use of DLC and OKRtrack for eye movement quantification in zebrafish OKR assays.
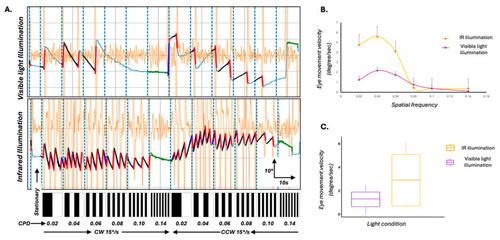
Optimisation of the OKR assay using infrared (IR) illumination to enhance behavioural response robustness. (A) Representative eye movement traces of 5 dpf wild-type zebrafish larvae exposed to full-field moving sinusoidal gratings under two lighting conditions: standard visible light (top) and IR illumination (bottom). Vertical blue dashed lines mark transitions in spatial frequency and direction of stimulus motion. Larvae under IR illumination exhibit clearer, higher slow-phase velocity optokinetic responses across stimulus epochs. Black overlays on the waveform represent the average slow phases and the red line represents the quick phases. Underlying eye movement trace is represented by light blue line. Orange waveforms represent the velocity trace. The bar below each panel illustrates the temporal sequence of stationary and moving gratings, with increasing spatial frequency (in cycles/degree (CPD) from left to right) and directional changes (clockwise (CW) and counterclockwise (CCW)). (B) Mean slow-phase eye velocity of the left eye as a function of spatial frequency under IR (yellow) and visible light (purple) conditions. IR illumination led to significantly enhanced eye velocities, particularly at intermediate spatial frequencies. Error bars represent standard error of the mean. (C) Box plots comparing overall eye movement velocity under IR and visible light conditions. Larvae tested under IR illumination showed significantly higher tracking velocities (p < 0.05), supporting the effectiveness of IR backlighting in enhancing OKR behavioural responses by reducing background noise and improving stimulus contrast.
Acknowledgments
This image is the copyrighted work of the attributed author or publisher, and
ZFIN has permission only to display this image to its users.
Additional permissions should be obtained from the applicable author or publisher of the image.
Full text @ Biology (Basel)
Your Input Welcome
Thank you for submitting comments. Your input has been emailed to ZFIN curators who may contact you if
additional information is required.
Oops. Something went wrong. Please try again later.