|
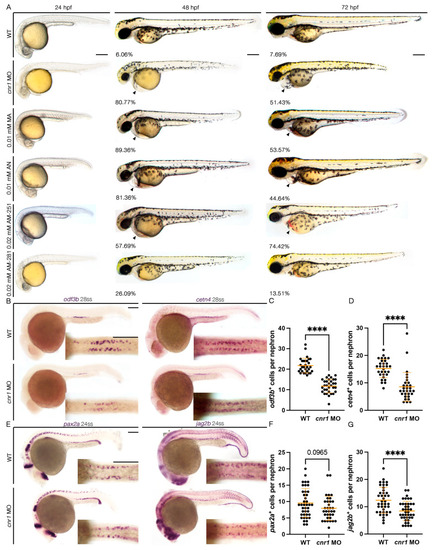
Loss of cnr1 leads to reduction in both mature and progenitor MCC populations: (A) live imaging between different treatment groups between 24 and 72 hpf with the percentage of embryos with edema between 48–72 hpf (arrows indicate pericardial edema); scale bar = 200 μm; (B) 28 ss WT, cnr1 MO stained via WISH using the mature MCC marker odf3b and cetn4; scale bar = 50 μm; (C,D) number of odf3b+ and cetn4+ cells per nephron at 28 ss; (E) 24 ss WT, cnr1 MO stained via WISH using the progenitor MCC marker pax2a and jag2b; scale bar = 50 μm; (F,G) number of pax2a+ and jag2b+ cells per nephron at 24 ss. Data presented on graphs are represented as mean ± SD; **** p < 0.0001 (t-test).
|