
FIGURE
Fig. 12
- ID
- ZDB-FIG-250627-114
- Publication
- Siegerist et al., 2025 - The differential expression of MAGI2 in glomerulopathies and its application as a molecular discriminator of podocytopathies
- Other Figures
- All Figure Page
- Back to All Figure Page
Fig. 12
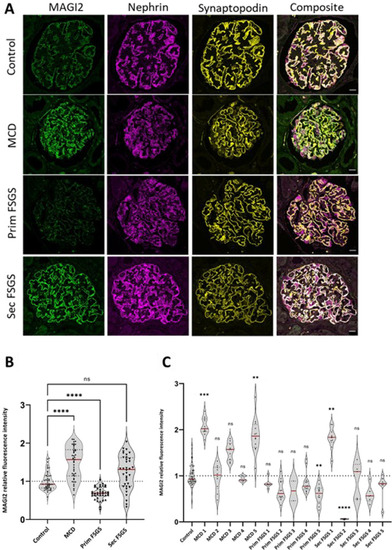
Glomerular MAGI2 expression is differentially regulated in MCD, primary FSGS, and secondary FSGS |
Expression Data
Expression Detail
Antibody Labeling
Phenotype Data
Phenotype Detail
Acknowledgments
This image is the copyrighted work of the attributed author or publisher, and
ZFIN has permission only to display this image to its users.
Additional permissions should be obtained from the applicable author or publisher of the image.
Full text @ J Transl Med