
Fig. 4
- ID
- ZDB-FIG-250612-4
- Publication
- Killinger et al., 2025 - Porcupine inhibition enhances hypertrophic cartilage differentiation
- Other Figures
- All Figure Page
- Back to All Figure Page
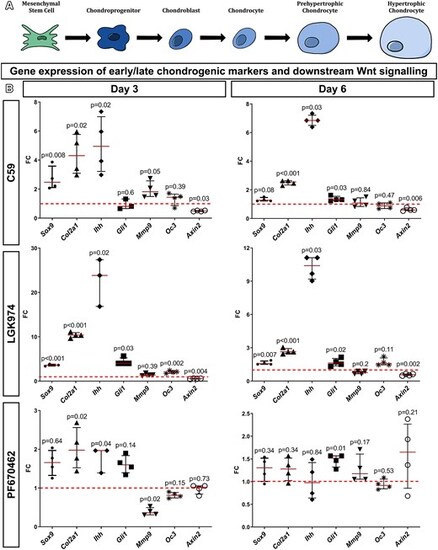
Gene expression analyses of chondrogenic markers in micromass cultures. (A) Schema of individual chondrocyte differentiation steps evaluated by qPCR. (B) Graphs of gene expression analyses of micromass cultures after 3 and 6 d of cultivations by qPCR. Inhibitors of PORCN (C59, LGK974) significantly enhanced the expression of Sox9 and Col2a1 already after 3 days’ cultivation, and Col2a1 expression remained escalated even after 6 d of cultivation. Ihh expression was increased at both time points when using any PORCN inhibitor, while Gli1 was only elevated in 6-d cultures. There were differences in the level of Gli1 expression between PORCN inhibitors in 3-d cultures, and only LGK974 displayed statistically significant upregulation. The expression of Mmp9 was increased in 3 d of cultivated micromasses after C59 treatment and Oc3 in 3 d of cultivated micromasses after LGK974 treatment. The expression of Axin2 was downregulated after treatment with PORCN inhibitors at both time points. On the other hand, PF670462 treatment caused insignificant changes in most of the analyzed genes except for Col2a1 upregulation or Mmp9 downregulation at 3-d cultures and increased expression of Ihh at both analyzed stages. The gene of interest expression level was related to Hprt1 gene expression, and FC as ratio to control micromasses are shown on graphs. Two-tailed Student’s t-test, Welch’s t-test or Mann–Whitney test was used for statistical analyses performed on samples from three independent experiments (refer to the Supplementary material for 2 additional repetitions of the experiments). Abbrevations: FC, fold changes; PORCN, Porcupine. |