
- Title
-
Porcupine inhibition enhances hypertrophic cartilage differentiation
- Authors
- Killinger, M., Szotkowská, T., Lusková, D., Zezula, N., Bryja, V., Buchtová, M.
- Source
- Full text @ JBMR Plus

PORCN expression during endochondral ossification in limbs and early chondrogenesis in micromasses. (A-D) PORCN and Sox9 expression detected in differentiated chondrocytes by immunohistochemistry. (A, B) PORCN signal was located in Sox9-positive cells during early endochondral ossification as observed at E13.5 of mice hindlimb. (C, D) Later at E18, weaker PORCN signal was observed in proliferating and prehypertrophic zone in the tibia growth plate while Sox9 expression was still strong. Nuclei are counterstained by DAPI. Scale bar = 100 μm. (E) Micromass cultures established from chicken forelimb buds (stage HH20) cultivated for 1, 3, and 6 d. Alcian blue staining uncovered the production of ECM from day 3 with the progression of its deposition at day 6. Small cartilaginous nodules were produced and observed from day 1 when visualized by hematoxylin staining. Scale bar = 1 mm. (F) PORCN expression analyzed by qPCR uncovered the highest expression in 1-d cultures and significantly decreased in micromasses cultivated for 3 and 6 d. (G) At the same time points, Sox9 and Col2a1 were evaluated to determine progress of chondrogenesis in micromass cultures. Gene expression was evaluated as a relative expression to Hprt1 gene expression (housekeeping). Four spots were seeded in each well, four wells were analyzed as biological replicates per cultivated conditions and each sample was run in 3 technical replicates in each qPCR reaction. Data are displayed as FC as the ratio to gene expression on day 1. Two-tailed Student’s t-test or Welch’s t-test was used for the statistical analyses performed on samples from three independent experiments (see Supplementary material for other repetitions). Abbrevations: ECM, extracellular matrix; FC, fold changes; PORCN, Porcupine. |

Effect of PORCN inhibitors on mesenchymal condensation formation and production of cartilaginous ECM. (A) Micromass cultures established from chicken forelimb buds (stage HH20) were cultivated for 3 d to evaluate the effect of Wnt inhibitors on early chondrogenesis. Alcian blue, hematoxylin, and rhodamine-conjugated PNA staining revealed an increased amount of cartilaginous nodules after C59 and LGK974 treatment. In contrast, the treatment with PF670462 reduced the amount of cartilaginous nodules (1 μM concentration of inhibitors was used). Scale bar = 1 mm. (B) Schema of experimental design. Micromasses were established from chicken forelimb buds (stage HH20) and were collected for gene expression analyses evaluated by qPCR or stained for the assessment of ECM production. (C) Micromass cultures established from chicken forelimb buds (stage HH20) cultivated for 6 d. Production of the ECM was evaluated using Alcian blue staining. An increased amount of ECM was produced after C59 and LGK974 treatment, while a low production level was observed after the PF670462 application. Three different concentrations of inhibitors were used (0.1 μM, 0.3 μM, or 1 μM), and progression in ECM production was observed with increased concentrations of PORCN inhibitors. Scale bar = 1 mm. (D) Graphs displaying analyses of blue pixels in Alcian blue stained micromasses treated with individual Wnt inhibitors after 6-d cultivations. Data is shown as a number of blue pixels. Two-tailed Student’s t-test or Welch’s t-test was used for statistical analyses (n = 4; spots evaluated per cultivated conditions) performed on samples from three independent experiments (see Supplementary material for other repetitions). Abbrevations: ECM, extracellular matrix; PNA, peanut agglutinin; PORCN, Porcupine. |
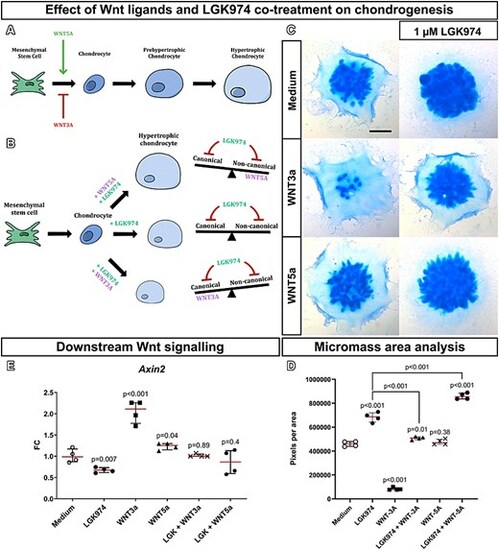
Impact of PORCN inhibition while simultaneously activating canonical or non-canonical Wnt pathway on chondrogenesis. (A) Schema of individual differentiation steps of chondrocytes evaluated during the study together with the general effect of WNTs on early chondrogenesis, where non-canonical signaling enhances differentiation of chondrocytes towards hypertrophy while canonical signaling behaves antagonistically and maintains cells in non-differentiated mesenchymal status. (B) Schema of experimental design and summary of results in challenging simultaneously canonical and non-canonical signaling in the mesenchymal cells. PORCN inhibitor LGK974 was applied on cells alone or in combination with WNT5a or WNT3a to evaluate the effect of PORCN inhibition on both signaling pathways. (C) ECM production was evaluated on micromasses established from chicken forelimb buds (stage HH20) that were cultivated with 1 μM LGK974 in combination with WNT3a (10 ng/mL) or WNT5a (10 ng/mL) for 6 d. Application of LGK974 rescued WNT3a inhibitory effect on chondrogenesis and enhanced ECM production in WNT5a treated cultures. Scale bar = 1 mm. (D) Graphs displaying the analyses of blue pixels in Alcian blue stained micromasses after 6 d of cultivation. A decreased amount of ECM was observed after WNT3a treatment, and the addition of LGK974 restored its production. WNT5a did not affect ECM production, and its level was comparable to control cultures. Simultaneous treatment of WNT5a and LGK974 significantly increased the amount of ECM. Data is displayed as a number of blue pixels. One-way ANOVA followed by post hoc analysis using Fisher’s LSD test was used for statistical analyses (n = 4; spots evaluated per cultivated conditions) performed on samples from three independent experiments (see Supplementary material for other repetitions). (E) Graphs of Axin2 expression analyses of micromass cultures after 6-d cultivations evaluated by qPCR. Four spots were seeded in each well, four wells were analyzed as biological replicates per cultivated conditions and each sample was run in three technical replicates in each qPCR reaction. The level of Axin2 expression was related to Hprt1 gene expression, and FC as the ratio to control micromasses are displayed in individual treatments. Two-tailed Student’s t-test or Welch’s t-test was used for statistical analyses performed on samples from three independent experiments (see Supplementary material for other repetitions). Abbrevations: ECM, extracellular matrix; FC, fold changes; PORCN, Porcupine. |
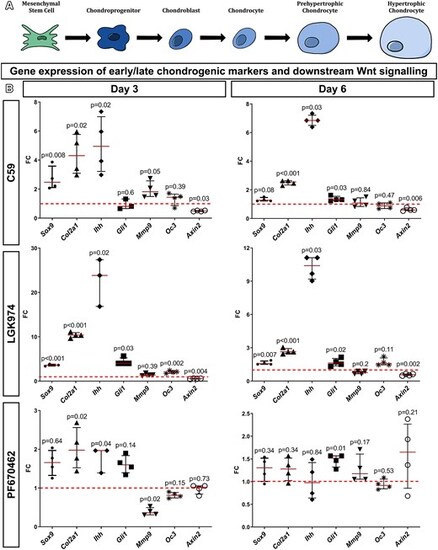
Gene expression analyses of chondrogenic markers in micromass cultures. (A) Schema of individual chondrocyte differentiation steps evaluated by qPCR. (B) Graphs of gene expression analyses of micromass cultures after 3 and 6 d of cultivations by qPCR. Inhibitors of PORCN (C59, LGK974) significantly enhanced the expression of Sox9 and Col2a1 already after 3 days’ cultivation, and Col2a1 expression remained escalated even after 6 d of cultivation. Ihh expression was increased at both time points when using any PORCN inhibitor, while Gli1 was only elevated in 6-d cultures. There were differences in the level of Gli1 expression between PORCN inhibitors in 3-d cultures, and only LGK974 displayed statistically significant upregulation. The expression of Mmp9 was increased in 3 d of cultivated micromasses after C59 treatment and Oc3 in 3 d of cultivated micromasses after LGK974 treatment. The expression of Axin2 was downregulated after treatment with PORCN inhibitors at both time points. On the other hand, PF670462 treatment caused insignificant changes in most of the analyzed genes except for Col2a1 upregulation or Mmp9 downregulation at 3-d cultures and increased expression of Ihh at both analyzed stages. The gene of interest expression level was related to Hprt1 gene expression, and FC as ratio to control micromasses are shown on graphs. Two-tailed Student’s t-test, Welch’s t-test or Mann–Whitney test was used for statistical analyses performed on samples from three independent experiments (refer to the Supplementary material for 2 additional repetitions of the experiments). Abbrevations: FC, fold changes; PORCN, Porcupine. |

The effect of PORCN inhibitors on the growth of cartilaginous 3D cultures. (A) Schema of experimental design of 3D cultures. The mesenchymal cells separated from chicken embryonic limbs (stage HH26) were seeded as hanging drops or in PDMS microwell platforms. (B) LGK974 treatment (1 μM) increased the size of 3D hanging drop cultures following 14 d of cultivation. Microscopic sections stained by Alcian blue exhibit enlargement of organoids as well as hypertrophic chondrocytes. Scale bars: macroscopic view = 1 mm, sections = 100 μm. (B´) Immunohistochemistry labeling of cytoplasmatic membranes by Na+/K+-ATPase to visualize cell outlines. Scale bar = 100 μm. (B´´) graphs displaying organoids cultured with Wnt inhibitors for 11 d, where C59 (1 μM) or LGK974 (1 μM) treatment exhibited increased size of organoids, while PF670462 (1 μM) treatment did not significantly change their size. Data are displayed as the number of pixels of the organoid area in Wnt inhibitor-treated samples relative to the size of organoids cultivated in medium (n = 8; organoids evaluated per cultivated conditions). Two-tailed Student’s t-test or Welch’s t-test was used for the statistical analyses. (B´´´) Cell area analyzed in ImageJ using Na+/K+-ATPase labeled cells cultivated as hanging drops. LGK974 (1 μM) treated cultures exhibited statistically significant enlargement of the cell surface compared to cells grown in the medium. The data represent the cell area (in μm2) of PORCN inhibitor-treated samples relative to the cell area of organoids grown exclusively in the medium (n = 20; cells evaluated per cultivated conditions). Two-tailed Student’s t-test or Welch’s t-test was used for the statistical analyses performed on samples from three independent experiments (refer to the Supplementary material for 2 additional repetitions of the experiments). Abbrevation: PORCN, Porcupine. |
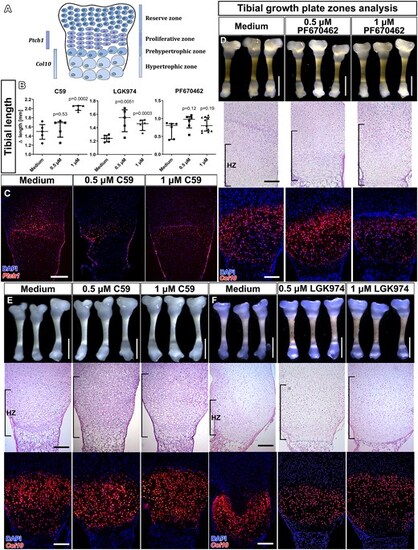
PORCN inhibitors alter endochondral ossification in tibias. Tibias isolated from E18 mouse embryos were cultured with Wnt inhibitors (C59, LGK974, PF670462) at concentrations of 0.5 or 1 μM. (A) Schema of individual zones during endochondral ossification and their markers selected for further analyses. (B) Differences in tibia length before and after 8 d of cultivation (data are displayed as subtraction of initial length from final bone length). At least 4 tibias were evaluated for each experimental condition. Two-tailed Student’s t-test or Mann–Whitney was used for the statistical analyses performed on samples from 3 independent experiments (see Supplementary material for other repetitions). (C) Expression of Ptch1 (marker of proliferating zone) detected on histological sections of cultivated tibias by RNAscope. The treatment with C59 (0.5 or 1 μM) downregulated Ptch1 expression in the tibia growth plate. Scale bar = 100 μm. (D) The overall appearance of tibias treated with PF670462 at the end of the experiment, where the shown tibias are representatives selected from 1 independent experiment after 8 d of cultivation. Histological sections stained by H&E reveal an increase in the hypertrophic zone (HZ) and a decrease of collagen type 10a1 (a marker of the HZ, DAPI counterstain nuclei). Scale bar = 100 μm. (E) The overall appearance of tibias treated with C59 at the end of the experiment. C59 treatment elongated tibias with a more considerable difference observed when using 1 μM concentration after 8 d of cultivation. An expanded HZ was observed on histological sections stained by H&E even at the lowest-used concentration (0.5 μM) of C59. Col10a1 (DAPI counterstain nuclei) expression slightly increased in tibias treated with C59 inhibitor. Scale bar = 100 μm. (F) Overall appearance of the tibia treated by LGK974 at the end of the experiment. LGK974 treatment noticeably elongated cultured tibias after 8 d of cultivation, especially when using 1 μM concentration. An expanded HZ was visible on histological sections stained with H&E at both analyzed concentrations. An increase of Col10a (red signal, DAPI counterstain nuclei) expression was observed in tibias treated with LGK974 inhibitor. Scale bar = 100 μm. Abbrevation: PORCN, Porcupine. |
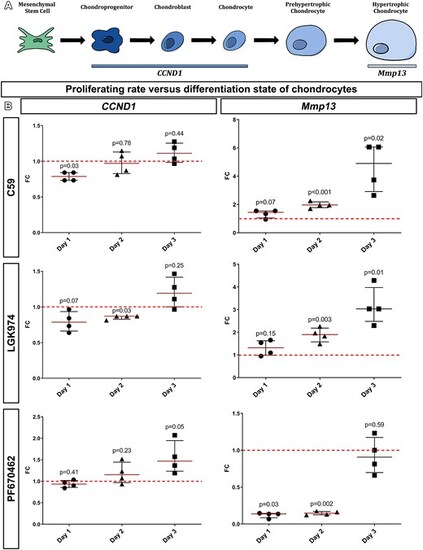
Determination of PORCN inhibitor’s effect on cell proliferation versus differentiation in early stages of cultivation. (A) Schema of individual chondrocyte differentiation steps in micromass cultures evaluated by qPCR. (B) Graphs of gene expression analyses of micromass cultures established from chicken limb buds (stage HH20) after 1, 2, and 3 d of cultivations, which were evaluated by qPCR. The level of CCND1 expression was reduced in the 1-d or 2-d cultivations with both PORCN inhibitors—C59 and LGK974 (1 μM), with no change observed in the expression at 3 d compared to control cultures. Mmp13 expression was significantly increased in 2-d micromass cultures after PORCN inhibition, and this trend was even more evident in 3-d micromasses. The gene of interest expression level was related to Hprt1 gene expression, and FC as ratio to control micromasses are shown on graphs. Two-tailed Student’s t-test, Welch’s t-test or Mann–Whitney test was used for statistical analyses performed on samples from three independent experiments (refer to the Supplementary material for 2 additional repetitions of the experiments). Abbrevations: FC, fold changes; PORCN, Porcupine. |
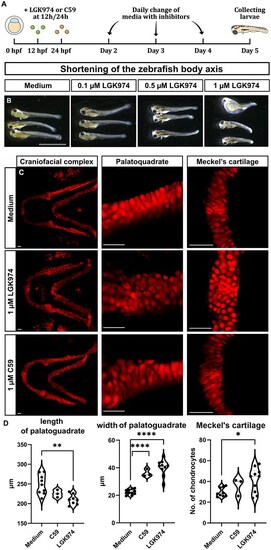
The effect of PORCN inhibitors on chondrogenesis in zebrafish embryos. (A) Schema of experimental design showing that PORCN inhibitors were added into zebrafish cultivation media at 0, 12, or 24 hpf to identify the effect of inhibitors during early embryogenesis or later during chondrogenesis in vivo. All embryos were collected at 5 dpf. (B) External morphology of zebrafish at stage 5 dpf. Increased concentration of LGK974 induced progressive shortening of the longitudinal axis of embryos in animals treated at 24 hpf. Scale bar = 2 mm. (C) Jaw cartilages of 4 dpf transgenic Sox10:DsRed zebrafish were shorter and thicker after cultivation with C59 or LGK974 (1 μM concentration added at 12 hpf) with a disrupted pattern of chondrocytes alignment. Scale bars: Lower view = 100 μm, details = 20 μm. (D) Analysis of palatoquadrate length, palatoquadrate width, and Meckel’s cartilage following C59 and LGK974 treatment. Statistical analyses were performed using the Mann–Whitney test (n = 6). Abbrevation: PORCN, Porcupine. |