
FIGURE
Fig. 2
- ID
- ZDB-FIG-250609-98
- Publication
- Molino et al., 2025 - Zebrafish Embryo Model as a Tool for Ecotoxicological Studies in Central Italy's Transitional Waters
- Other Figures
- All Figure Page
- Back to All Figure Page
Fig. 2
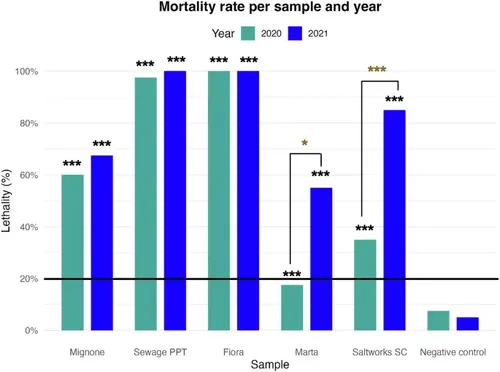
Zebrafish embryo mortality percentage of the five environmental samples collected in November 2020 (Exp 1) and February 2021 (Exp 2) obtained with FET test. Black stars refer to the comparison between treated samples vs negative control (significance of Chi-squared test (χ2): *** p ≤ 0.001). Brown stars refer to the comparison between one year and another (significance of Chi-squared test (χ2): * p ≤ 0.05; significance of Chi-squared test (χ2): *** p ≤ 0.001). The horizontal line at 20% is the threshold beyond which a sample is considered toxic to zebrafish embryos |
Expression Data
Expression Detail
Antibody Labeling
Phenotype Data
Phenotype Detail
Acknowledgments
This image is the copyrighted work of the attributed author or publisher, and
ZFIN has permission only to display this image to its users.
Additional permissions should be obtained from the applicable author or publisher of the image.
Full text @ Environ Manage