
FIGURE
Fig. 1
- ID
- ZDB-FIG-250609-97
- Publication
- Molino et al., 2025 - Zebrafish Embryo Model as a Tool for Ecotoxicological Studies in Central Italy's Transitional Waters
- Other Figures
- All Figure Page
- Back to All Figure Page
Fig. 1
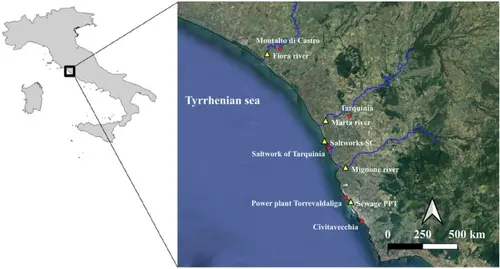
Map of the study area. Red dots represent the main landmarks in the area, whereas yellow triangles represent the five sampling sites. The three main river courses are highlighted in blue |
Expression Data
Expression Detail
Antibody Labeling
Phenotype Data
Phenotype Detail
Acknowledgments
This image is the copyrighted work of the attributed author or publisher, and
ZFIN has permission only to display this image to its users.
Additional permissions should be obtained from the applicable author or publisher of the image.
Full text @ Environ Manage