|
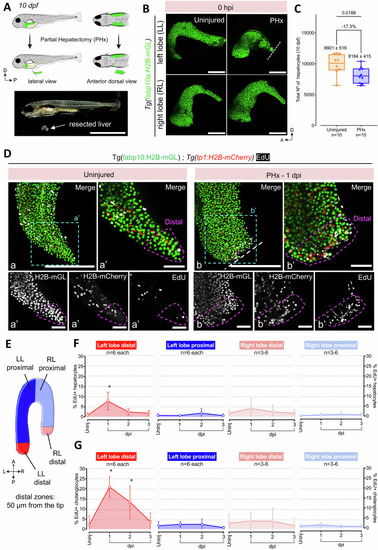
Establishment of a partial hepatectomy (PHx) model of liver regeneration. A Schematic illustration (above) and brightfield image (below) showing the surgical procedure for PHx of the left lobe in 10 dpf larvae. B Representative confocal images of the left and right liver lobe from uninjured or 0 hours-post-injury (hpi) PHx Tg(fabp10a:H2B-mGL) animals. Site of resection marked with white dashed line. C Min-to-max boxplot showing quantification of the total number of hepatocytes (nuclei) at 10 dpf in the livers subjected to PHx (n = 10 animals, each) (Two-tailed Welch’s t test). Each dot represents one animal; mean ± SEM is indicated above each box. D Confocal images of livers from EdU labeled Tg(fabp10a:H2B-mGL); Tg(tp1:H2B-mCherry) animals at 11 dpf (uninjured) and 1 dpi. Scale bar: 200 μm (a, b), 50 μm (a’, b’). E Schematic depicting the segregation of the liver lobes into a distal region of 50 μm thickness and a proximal region. F, G Quantification representing Mean ± SD of the percentage of EdU+ hepatocytes (F) and cholangiocytes (G) in uninjured, 1-, 2- and 3-dpi separated by distal and proximal regions of the left (injured) (n = 6 animals each) and right (uninjured) (n = 6, 6, 3, 5 animals, respectively) lobe. (ANOVA followed by Kruskal–Wallis test; *p-value < 0.05).
|