IMAGE

Fig. 3

ID
ZDB-IMAGE-250609-79
Source
Figures for Eski et al., 2025
Image
Figure Caption

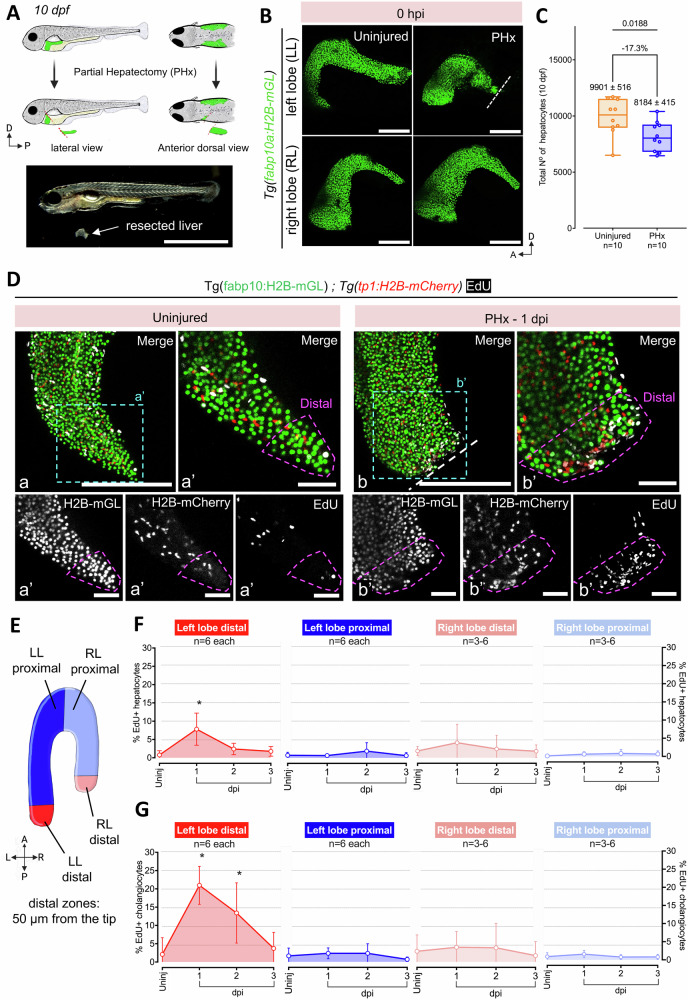
Fig. 3 Establishment of a partial hepatectomy (PHx) model of liver regeneration.

A Schematic illustration (above) and brightfield image (below) showing the surgical procedure for PHx of the left lobe in 10 dpf larvae. B Representative confocal images of the left and right liver lobe from uninjured or 0 hours-post-injury (hpi) PHx Tg(fabp10a:H2B-mGL) animals. Site of resection marked with white dashed line. C Min-to-max boxplot showing quantification of the total number of hepatocytes (nuclei) at 10 dpf in the livers subjected to PHx (n = 10 animals, each) (Two-tailed Welch’s t test). Each dot represents one animal; mean ± SEM is indicated above each box. D Confocal images of livers from EdU labeled Tg(fabp10a:H2B-mGL); Tg(tp1:H2B-mCherry) animals at 11 dpf (uninjured) and 1 dpi. Scale bar: 200 μm (a, b), 50 μm (a’, b’). E Schematic depicting the segregation of the liver lobes into a distal region of 50 μm thickness and a proximal region. F, G Quantification representing Mean ± SD of the percentage of EdU+ hepatocytes (F) and cholangiocytes (G) in uninjured, 1-, 2- and 3-dpi separated by distal and proximal regions of the left (injured) (n = 6 animals each) and right (uninjured) (n = 6, 6, 3, 5 animals, respectively) lobe. (ANOVA followed by Kruskal–Wallis test; *p-value < 0.05).

Acknowledgments
This image is the copyrighted work of the attributed author or publisher, and ZFIN has permission only to display this image to its users. Additional permissions should be obtained from the applicable author or publisher of the image. Full text @ Nat. Commun.