|
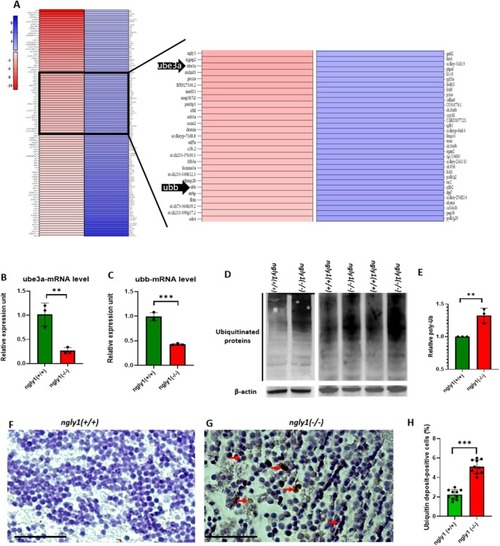
Impaired ubiquitin‐mediated protein degradation in the adult ngly1(−/−)fish brain. (A) Heat map presentation of RNA sequencing of zebrafish brains, red = downregulation and blue = upregulation, the scale indicates fold change values. (B, C) RT‐qPCR quantification of ube3a(B) and ubb(C) mRNA levels. ** T‐test p < 0.01, *** T‐test p < 0.001 (ngly1(+/+)n = 3, ngly1(−/−)n = 3, ube3a, ubb). (D) Western blot analysis of zebrafish brain with an antibody against poly‐ubb; β‐Actin was used as a loading control. (E) Quantification of western blot‐determined ubiquitinated protein levels. **T‐test p < 0.01 (ngly1(+/+)n = 9, ngly1(−/−)n = 9). Representative immunohistochemistry images of ngly1(+/+)(F) and ngly1(−/−)(G) zebrafish brains periventricular gray zone (PGZ) reacted with anti‐poly‐ubb antibody, (H) Percentage of ubiquitin deposit‐positive cells. ***T‐test p < 0.001 (N = 10 in each group). Red arrows indicate cells with ubiquitinated protein accumulation.
|