
FIGURE 3
- ID
- ZDB-IMAGE-250609-42
- Genes
- Antibodies
- Publication
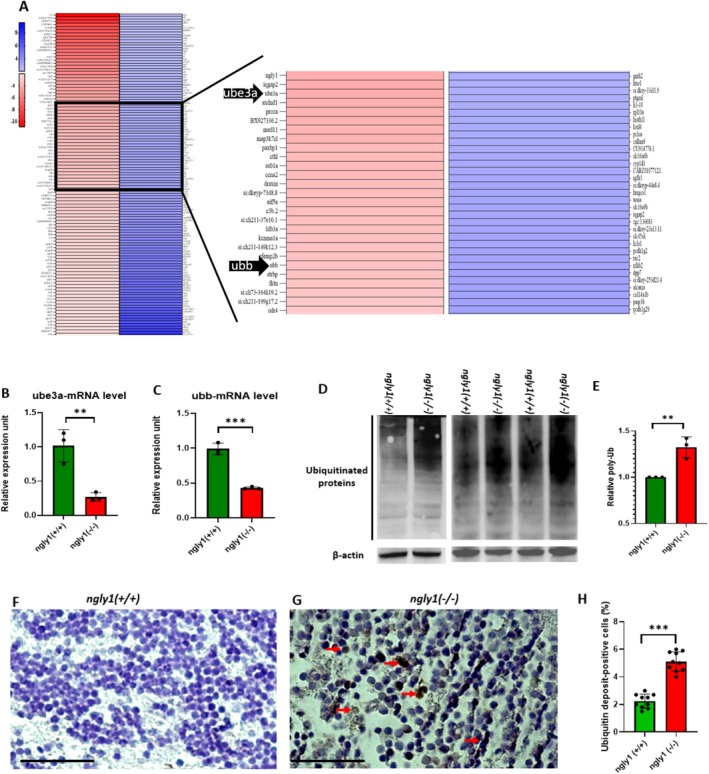
- Mesika et al., 2025 - Impaired Proteostasis is Linked to Neurological Pathology in a Zebrafish NGLY1 Deficiency Model
- All Figures
- Figures for Mesika et al., 2025
|
FIGURE 3