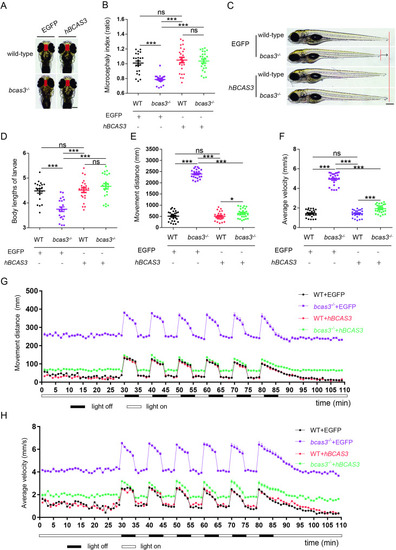
Human BCAS3 gene rescued the developmental deficiency and locomotor defects of bcas3 KO larvae. (A-B), Microcephaly index (the interocular distances/body length) comparison of 5 dpf WT and bcas3−/− larvae injected with EGFP or EGFP-hBCAS3. Representative images (A) and quantitative analysis of the interocular distances/body length in 5 dpf larvae, (n = 23, per group). hBCAS3, human BCAS3. (C-D), Body length comparison of 5 dpf WT and bcas3−/− larvae injected with EGFP or hBCAS3. Representative images (C) and quantitative analysis of body lengths (D) in 5 dpf larvae. WT + EGFP (n = 20), bcas3−/− + EGFP (n = 20), WT + EGFP-hBCAS3 (n = 22), bcas3−/− + EGFP-hBCAS3 (n = 22). Scale bars: 500 μm. (E-F), The basic movement of zebrafish, injected with EGFP or EGFP-hBCAS3, under light condition. Quantitative analysis of distance (E) and average velocity (F) in 6 dpf WT and bcas3−/− larvae. (n = 24, per group). (G), Graph illustrating the movement distance of 6 dpf zebrafish, injected with EGFP or EGFP-hBCAS3, to alternating light-dark conditions, with periods consisting of 5-minute darkness and 5-minute light. The plot graph represents the movement distance of larvae per minute. WT + EGFP (n = 24), bcas3−/− + EGFP (n = 24), WT + EGFP-hBCAS3 (n = 23), bcas3−/− + EGFP-hBCAS3 (n = 22). (H), Graph illustrating the average velocity of 6 dpf zebrafish, injected with EGFP or EGFP-hBCAS3, to alternating light-dark conditions, with periods consisting of 5-minute darkness and 5-minute light. The plot graph represents the average velocity of larvae per minute. WT + EGFP (n = 24), bcas3−/− + EGFP (n = 24), WT + EGFP-hBCAS3 (n = 23), bcas3−/− + EGFP-hBCAS3 (n = 22). Data are shown as mean ± SEM. One-way ANOVA was used to analyze interocular distances, body length, movement distance and average velocity. Significance levels are denoted as follows: ***P < 0.001. ns, not significant
|
