FIGURE

Figure 3

ID
ZDB-FIG-250607-3
Publication
Wragg et al., 2025 - A dual readout embryonic zebrafish xenograft model of rhabdomyosarcoma to assess clinically relevant multi-receptor tyrosine kinase inhibitors
Other Figures
All Figure Page
Back to All Figure Page
Figure 3

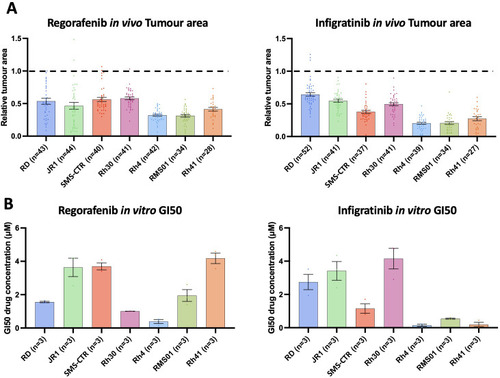
Regorafenib and infigratinib treatment inhibits RMS xenograft tumour growth. (A), Xenografts generated from the 7 RMS cell lines were treated with 0.1 µM regorafenib and infigratinib for 66 hours. Bar graphs of tumour area for treated xenografts relative to the average vehicle treated tumour area for each cell line. Dotted line indicates level of relative tumour area for vehicle treated xenografts (1.0 = 100% for each cell line). (B), RMS cell lines were treated in vitro in 2D with regorafenib and infigratinib at a range of concentrations (0.1-10 µM) for 7 days (as described in Supplementary Figure 6a) with the drug concentration inducing a 50% reduction in maximum cell surface, relative to vehicle treated (GI50) calculated and shown in the bar graphs. Data are presented as mean values +/- SEM. n = number of xenografts.

Expression Data

Expression Detail
Antibody Labeling
Phenotype Data

Phenotype Detail
Acknowledgments
This image is the copyrighted work of the attributed author or publisher, and ZFIN has permission only to display this image to its users. Additional permissions should be obtained from the applicable author or publisher of the image. Full text @ Front Oncol