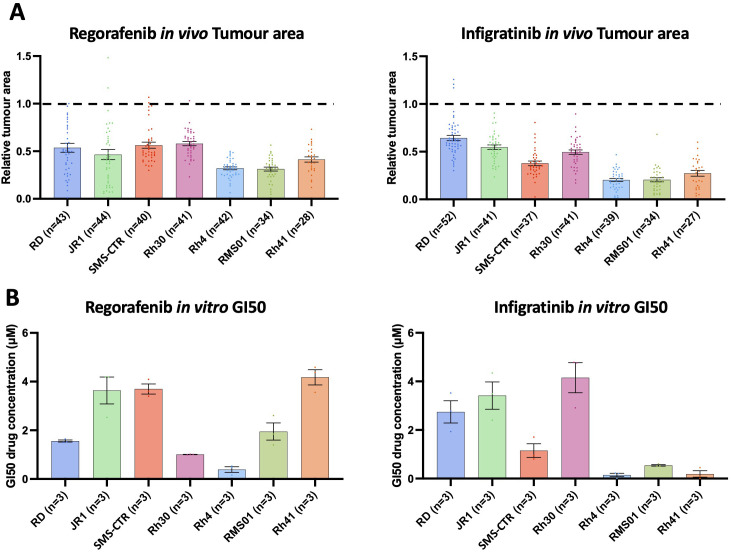
Regorafenib and infigratinib treatment inhibits RMS xenograft tumour growth. (A), Xenografts generated from the 7 RMS cell lines were treated with 0.1 µM regorafenib and infigratinib for 66 hours. Bar graphs of tumour area for treated xenografts relative to the average vehicle treated tumour area for each cell line. Dotted line indicates level of relative tumour area for vehicle treated xenografts (1.0 = 100% for each cell line). (B), RMS cell lines were treated in vitro in 2D with regorafenib and infigratinib at a range of concentrations (0.1-10 µM) for 7 days (as described in Supplementary Figure 6a) with the drug concentration inducing a 50% reduction in maximum cell surface, relative to vehicle treated (GI50) calculated and shown in the bar graphs. Data are presented as mean values +/- SEM. n = number of xenografts.
Acknowledgments
This image is the copyrighted work of the attributed author or publisher, and
ZFIN has permission only to display this image to its users.
Additional permissions should be obtained from the applicable author or publisher of the image.
Full text @ Front Oncol
Your Input Welcome
Thank you for submitting comments. Your input has been emailed to ZFIN curators who may contact you if
additional information is required.
Oops. Something went wrong. Please try again later.