
Fig. 3
- ID
- ZDB-FIG-250603-51
- Publication
- Grzymala et al., 2025 - Metabolomic and lipidomic profiling reveals convergent pathways in attention deficit hyperactivity disorder therapeutics: Insights from established and emerging treatments
- Other Figures
- All Figure Page
- Back to All Figure Page
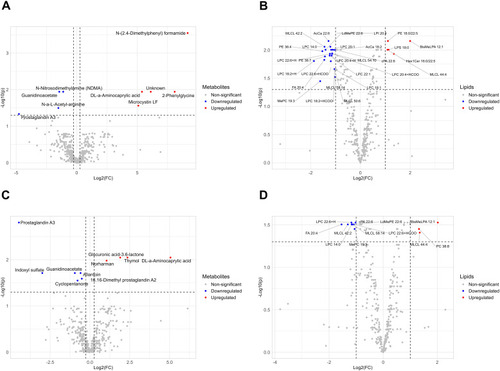
The effect of nonstimulants (A and B) atomoxetine and (C and D) guanfacine on the whole-body metabolome of adgrl3.1 mutant larvae. Volcano plot of identified (A, C) metabolites and (B, D) lipids in adgrl3.1 mutant larvae treated with either (A, B) atomoxetine or (C, D) guanfacine compared with untreated adgrl3.1 mutant larvae. Blue dots indicate significant downregulation, red dots significant upregulation, and gray dots nonsignificant changes. Metabolic changes in (A) atomoxetine-treated larvae included 9 differential metabolites, with 4 downregulated and 5 upregulated, while those in (C) guanfacine-treated larvae included 10 differential metabolites, with 6 downregulated and 4 upregulated. Lipid changes in (B) atomoxetine-treated larvae included 25 significantly altered lipids, with 20 downregulated and 5 upregulated, while those in (D) guanfacine-treated larvae included 11 significantly altered lipids, with 8 downregulated and 3 upregulated. Each group consisted of 3 biological replicates, with 50 pooled larvae per replicate. Differential metabolites were identified through an FC of ≥1.2 or ≤0.83 and an FDR-adjusted P value of ≤.05. Significantly altered lipids were identified through an FC of ≥1 or ≤0.5 and an FDR-adjusted P value of ≤.05. cPA, cyclic phosphatidic acid; LdMePE, lysodimethylphosphatidylethanolamine; MePC, methyl phosphatidylcholine. |